Browsing and Filtering Data
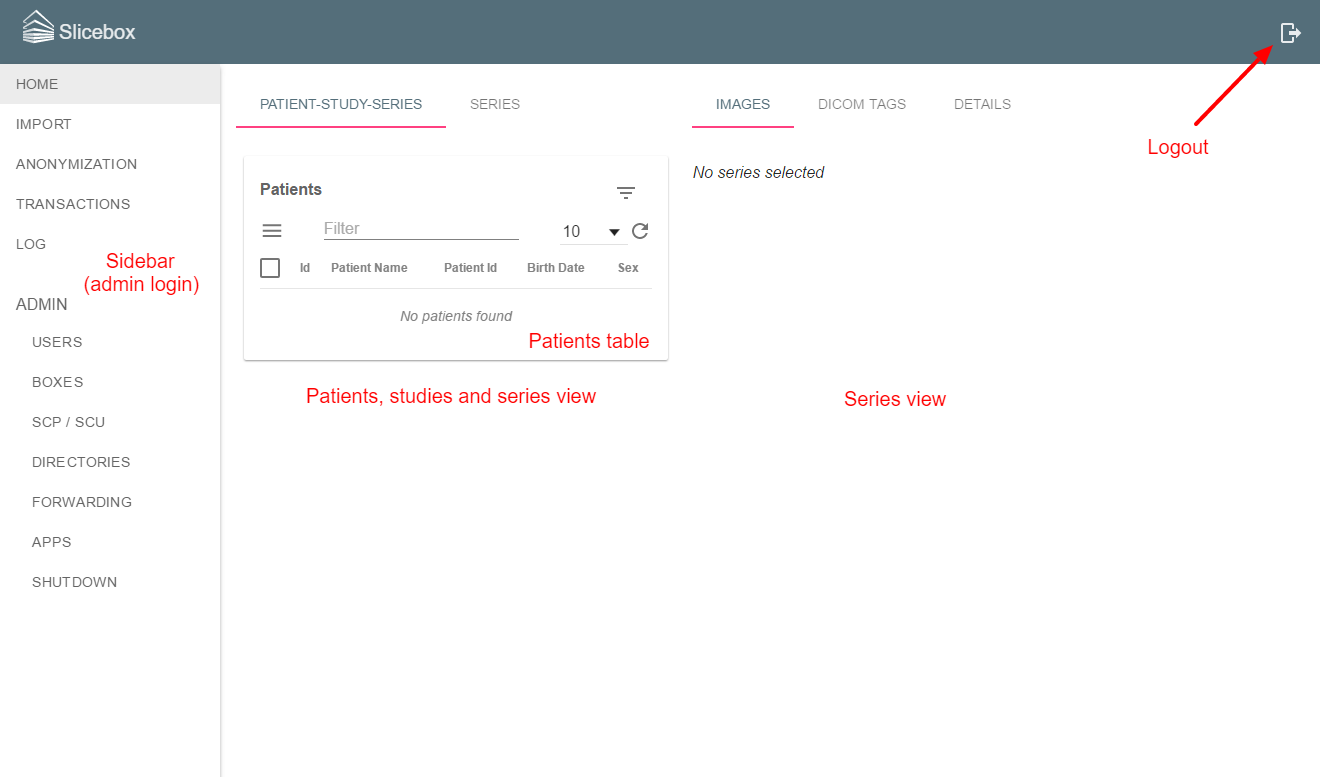
Once data has been imported into slicebox, it can be browsed from the home view. Selected patients, studies or series can be sent to collaborators, deleted, tagged, exported and many other things. This page describes how to browse and filter data in order to find the correct data set to process.
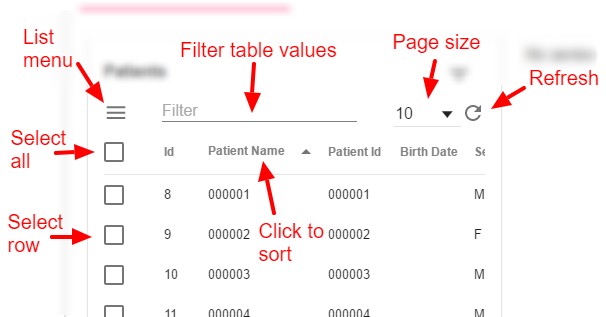
The slicebox user interface uses a common component for lists. There are lists of patients, studies and series; PACS connections, transactions, users and many other. Each list support one or more of the following features
- Selecting a row
- Selecting all visible rows
- Displaying a list menu with various operations on selected rows
- Changing the page size
- Refreshing the list, useful when the underlying data is currently changing
- Sortable columns (by clicking on the column header)
- Filtering on table values (applies to all data, not just the visible rows)
The following image shows a list of patients where all these features are available.
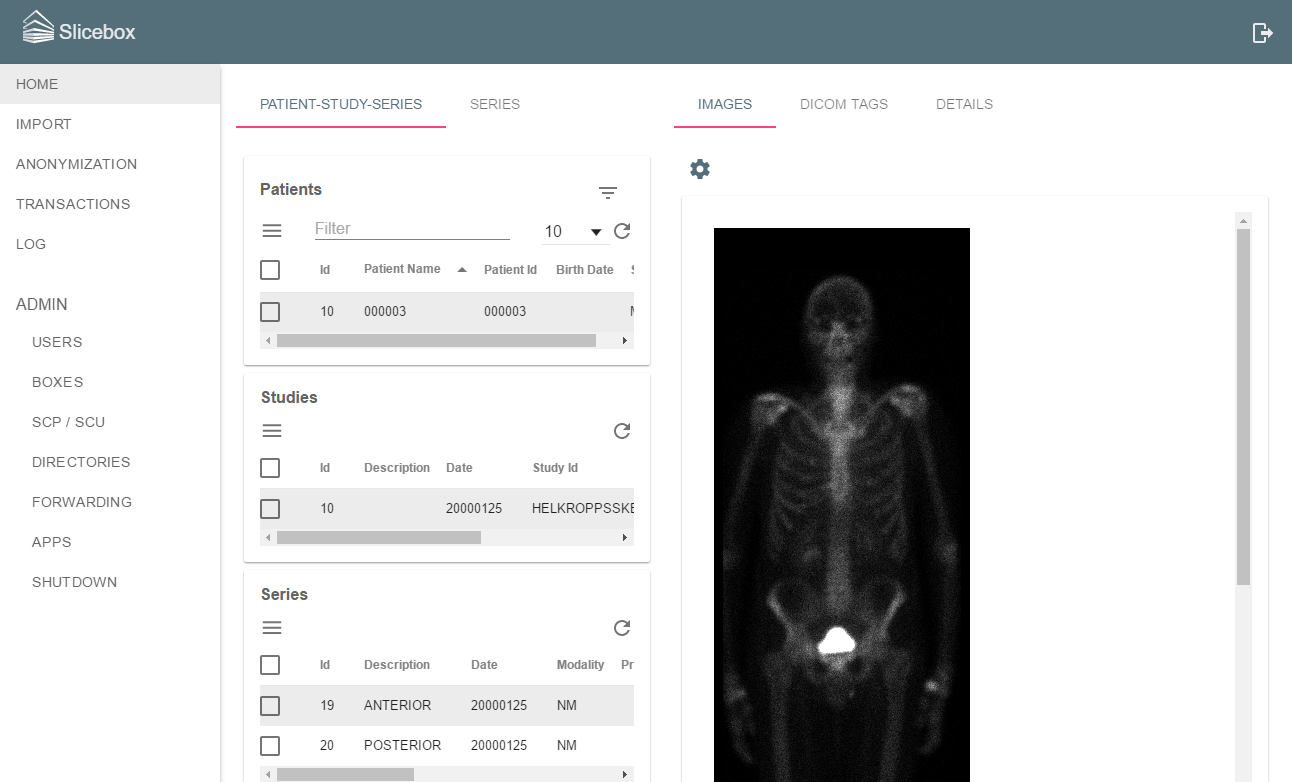
Slicebox offers two ways of browsing your DICOM data, the Patient-Study-Series hierarchical view and a flat view of All Series, with study and patient information merged into each series (table row). The two tabs on the top of the left column of the image below selects between these.
The Patient-Study-Series view initially contains a list of patients where each row corresponds to a unique patient name and patient ID combination. Clicking a row will select the corresponding patient and reduces the patient list such that it only contains the selected patient. At the same time, a list of studies for the selected patient will appear. Clicking a row in the list of studies will select the corresponding study and reduces the studies list to the selected study and opens a list of available series for the selected patient and study. When a series is selected, the right column of the home view will show information on the selected series. The below image show the home view when a patient, study and series has been selected.
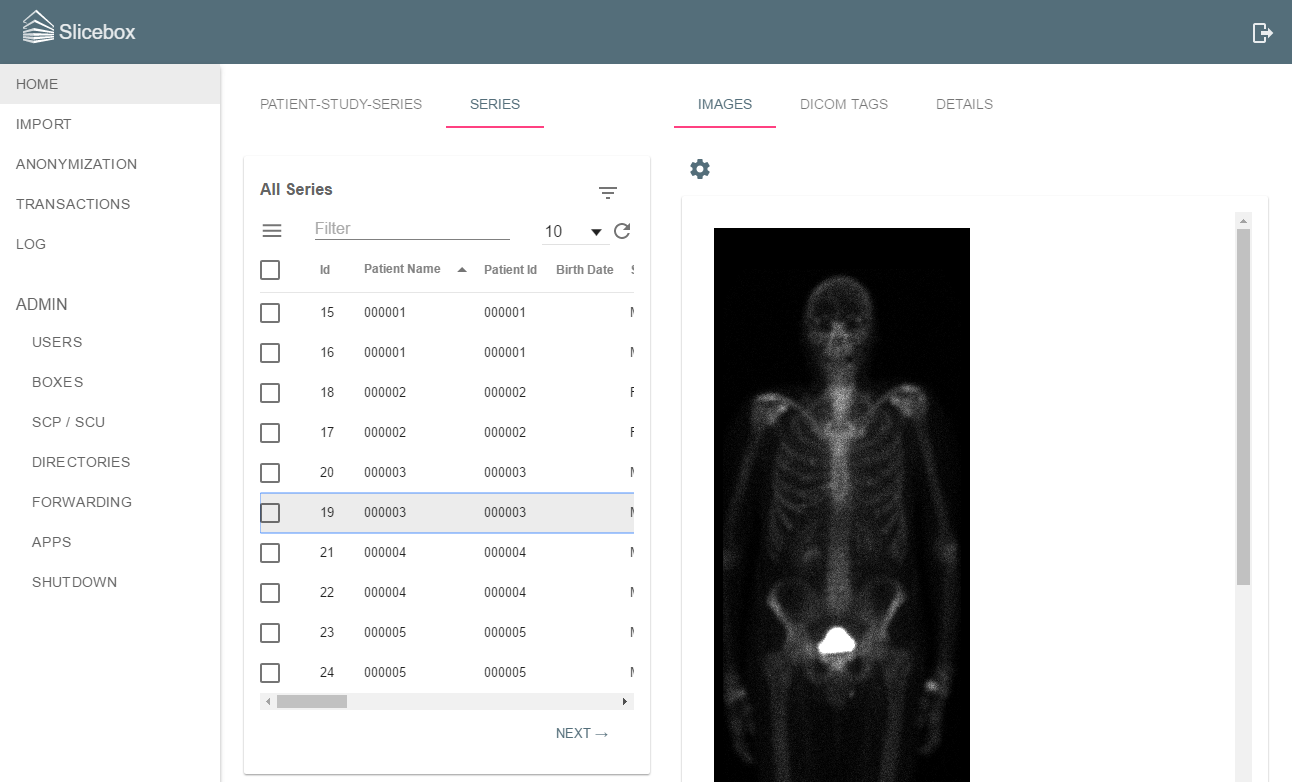
Alternatively the same series can be selected in the flat series view as shown below.
The series view column is divided into three tabs, described here.
This view provides basic viewing of the images contained in a series. By default, only the first image in the series will be shown in its original size using the intensity window suggested by its relevant DICOM attributes. The cog-wheel button at the top of the view opens a menu with various image viewing settings. The number of images to show can be changed along with the image size and the intensity window.
This view shows a table of all present DICOM attributes of the first image in the series. The Path column show the path of sequence tag names for each attribute. Base-level attributes have no path.
This view shows slicebox-specific information stored for each series and/or image. For each image, slicebox keeps track of its origin, called Source. Examples of sources are a box connection, a watched directory or a PACS connection. Each series has zero, one or more tags and types. Tags are free-text labels manually added by slicebox users to keep track of groups of series, such as those belonging to a particular research study. See Getting Organized for more information on this topic. Types are automatically assigned labels based on expected values for selected DICOM attributes. Types are typically used for integration between slicebox and imaging applications, see Integrating with Applications for more information. The details view also contains a list of all images in the series, shown as links to each DICOM file.
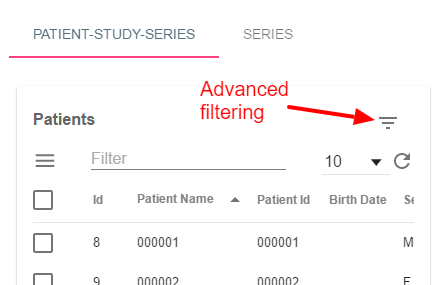
The Patients and All Series tables provide more options for filtering besides the free-text filter box above the table. The filtering symbol button on the top right corner shown in the following image opens a dialog with options for filtering on one or more sources, series tags and series types.
An example modal with a few options for the categories source, series tags and series types are shown below.
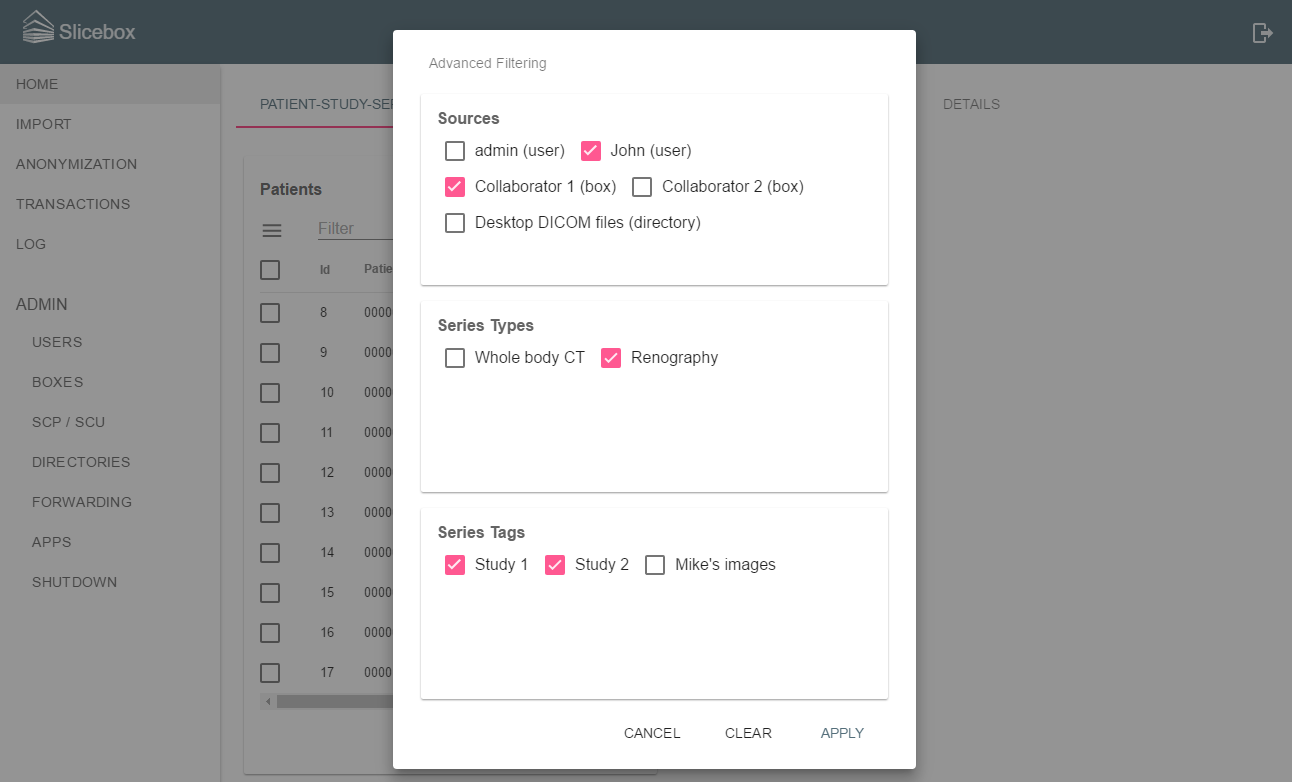
Selecting several options within a category such as sources are combined with logical OR, while the categories themselves are grouped using logical AND. The filtering resulting from the screenshot will show images with (John OR Collaborator 1) AND Renography AND (Study 1 OR Study 2). The resulting selection of images can then be further filtered using the free-text filter box and sorted as without advanced filtering.