other analyses of diverse topics, all work and opinions are my own
Not all children learn their native language at the same rate.

Some replots of data regarding efficiency of land usage, carbon emissions, and crop yields

Many countries with long coastlines still import a lot of their fish. This is viewable on my interactive online RShinyApp, which apparently works on mobile phones too. Data are from UN FAO.

Month of birth has real effects, like astrology, something known by all of humanity for thousands of years. Data from the UN data portal.

Replots of food aversions and cravings during pregnancy, NVP, and related things

Countries like France and Spain have the same number of applications, but France is twice as successful. Data from ERC statistics tables, and from MSCA-IF 2018 table

Some countries with a peak tourism season need to run at double capacity for 2-3 months, or are at half capacity for the rest of the year. Tourism arrivals data from UN World Tourism Organization 2019 Tourism Highlights containing counts for 2018, population data are from World Population Clock.

Any formula can be used on any person, even if it should not, reminding us that "when a measure becomes a target, it ceases to be a good measure"

Occurrence of samples from each kingdom, phylum and class in public databases. Data in the archives are dominated by model organism samples. This is also integrated into an interactive ShinyApp map.

In addition to a poor choice in color scheme, the original paper figures did not explain much about the diversity of samples. Additional processing of this dataset was used for Orsi 2018

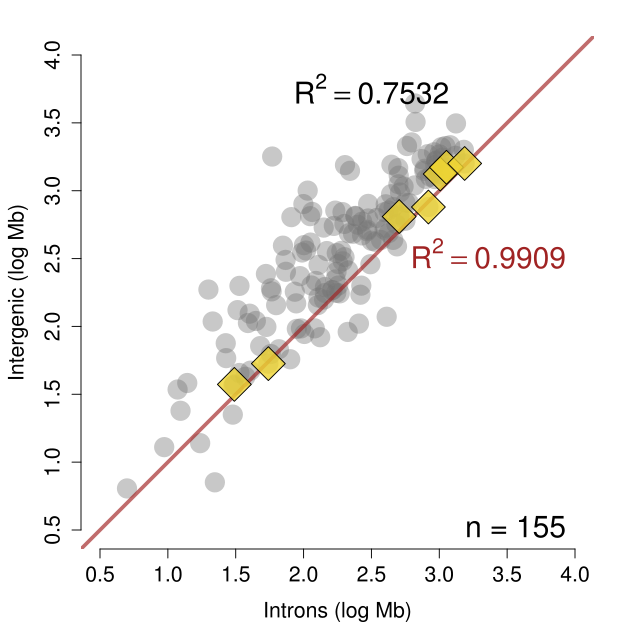
Introns become longer by a runaway expansion model, creating an exponential distribution of length. This was a follow up to Francis 2017 Similar ratios of introns to intergenic sequence across animal genomes.

Data for the paper of Francis 2017 showing the ratio of intronic bases to intergenic bases. Original version had 68 species, though many more have been added since.
A simple model about bootstrapping in phylogenetics, showing that bootstrap replicates do not reflect the uncertainty in the data. This topic came up following the work of Shen 2017.

Data digitized from Ecology and Evolution in Anoxic Worlds by Fenchel and Finlay (1995).

Collection of bioluminescence spectra, some original, and some digitized from old papers
