This is a collection of the research I completed as a student at UC Santa Barbara's Research Mentorship Program under the direction of Carlos Baez (faculty mentor) and Dr. Lina Kim (program director). In my research, I aimed to quantify the effects of different demographic factors on the availability of scooter-share vehicles (such as those provided by Lime) in Washington, D.C., particularly focusing on income and race. I found that, while income was not statistically significant, race was. This was an unexpected finding since one would expect that race should have no effect on the distribution of scooter-share vehicles.
I have included in this repository the R scripts used to download, compile, and visualize the data, as well as the shapefiles for use in QGIS and GeoDa.
In the past few years, private companies, such as Lime and Bird, have begun distributing dockless, electric scooters (e-scooters) to provide increased short-distance transportation options. This new form of transportation has been wildly successful. In 2018, the year e-scooters were introduced, more trips were taken on e-scooters than on all other micro-mobility options (such as bike-share) combined (Dupuis et al. 2019). Micro-mobility has the potential to increase access to public transportation as well as reduce carbon emissions.
We chose to collect data from Washington, D.C. because all scooter-share companies are required to share the locations of their scooters when not in use. The uniformity and accessibility of the data made D.C. an ideal location. From July 17th to July 24th, we downloade\d data from 5 companies (Bird, Lime, Skip, Lyft, and Jump) using an R script and Cronjob (a job scheduler for Unix-like operating systems). Files included information about vehicle id numbers and location.
After collecting individual data points, we then calculated which consecutive points had a displacement of over 80 meters and labeled them as “trips” (the threshold was based on Grant McKenzie’s work on micro-mobility to account for GPS inaccuracies). We then sorted the resulting “trips” into three categories.
First, relocation trips are ones in which scooters are transported by car to a different location by the company. These are trips for which the scooter travels over 15.5 mph since that is the top speed of an e-scooter.
Next, recharging trips are one in which either company employees or crowdsourced gig economy workers recharge the e-scooters’ batteries. These are trips whose duration exceeds 2 hours since e-scooters cannot travel for over 2 hours on a single charge.
Finally, consumer-ride trips are those that don’t fall under the previous two categories and are assumed to be trips for which consumers are paying to use the e-scooters.
The demographic and socio-economic data in this study was sourced from the American Community Survey (ACS) at the census tract level. We used multiple variables to approximate the income of a census tract (such as the number of households receiving SNAP benefits), in addition to considering the percentage of African-Americans, education level, and unemployment rate.
Below are the cartograms, line plots, and Poisson regression generated from our data. It is worth noting that, beginning at 8am on July 22nd, noticeably fewer trips were recorded than in the preceding days. All 5 companies recorded fewer trips over this period. Given that there were no significant news events at that time, this is likely an issue with either our server or with Washington, D.C.’s APIs. We still included these days in our analysis because they still show similar trends, but simply reduced in magnitude.
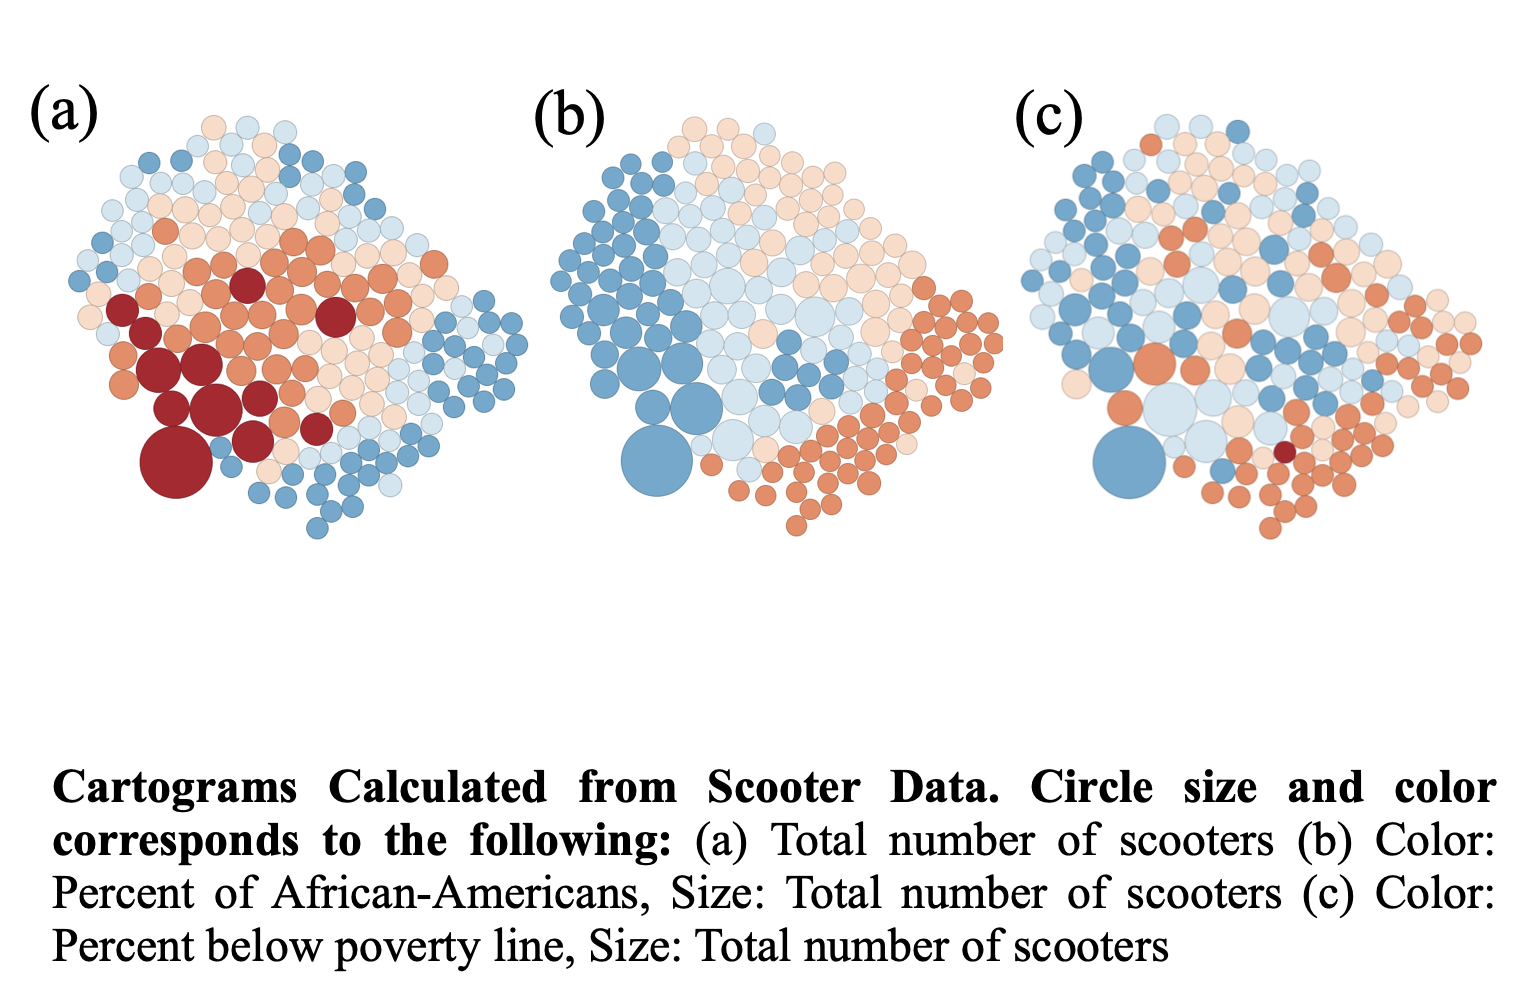 In the cartograms, we see that race has a closer correlation to e-scooter activity than income (the variations in color more closely match the variations in size).
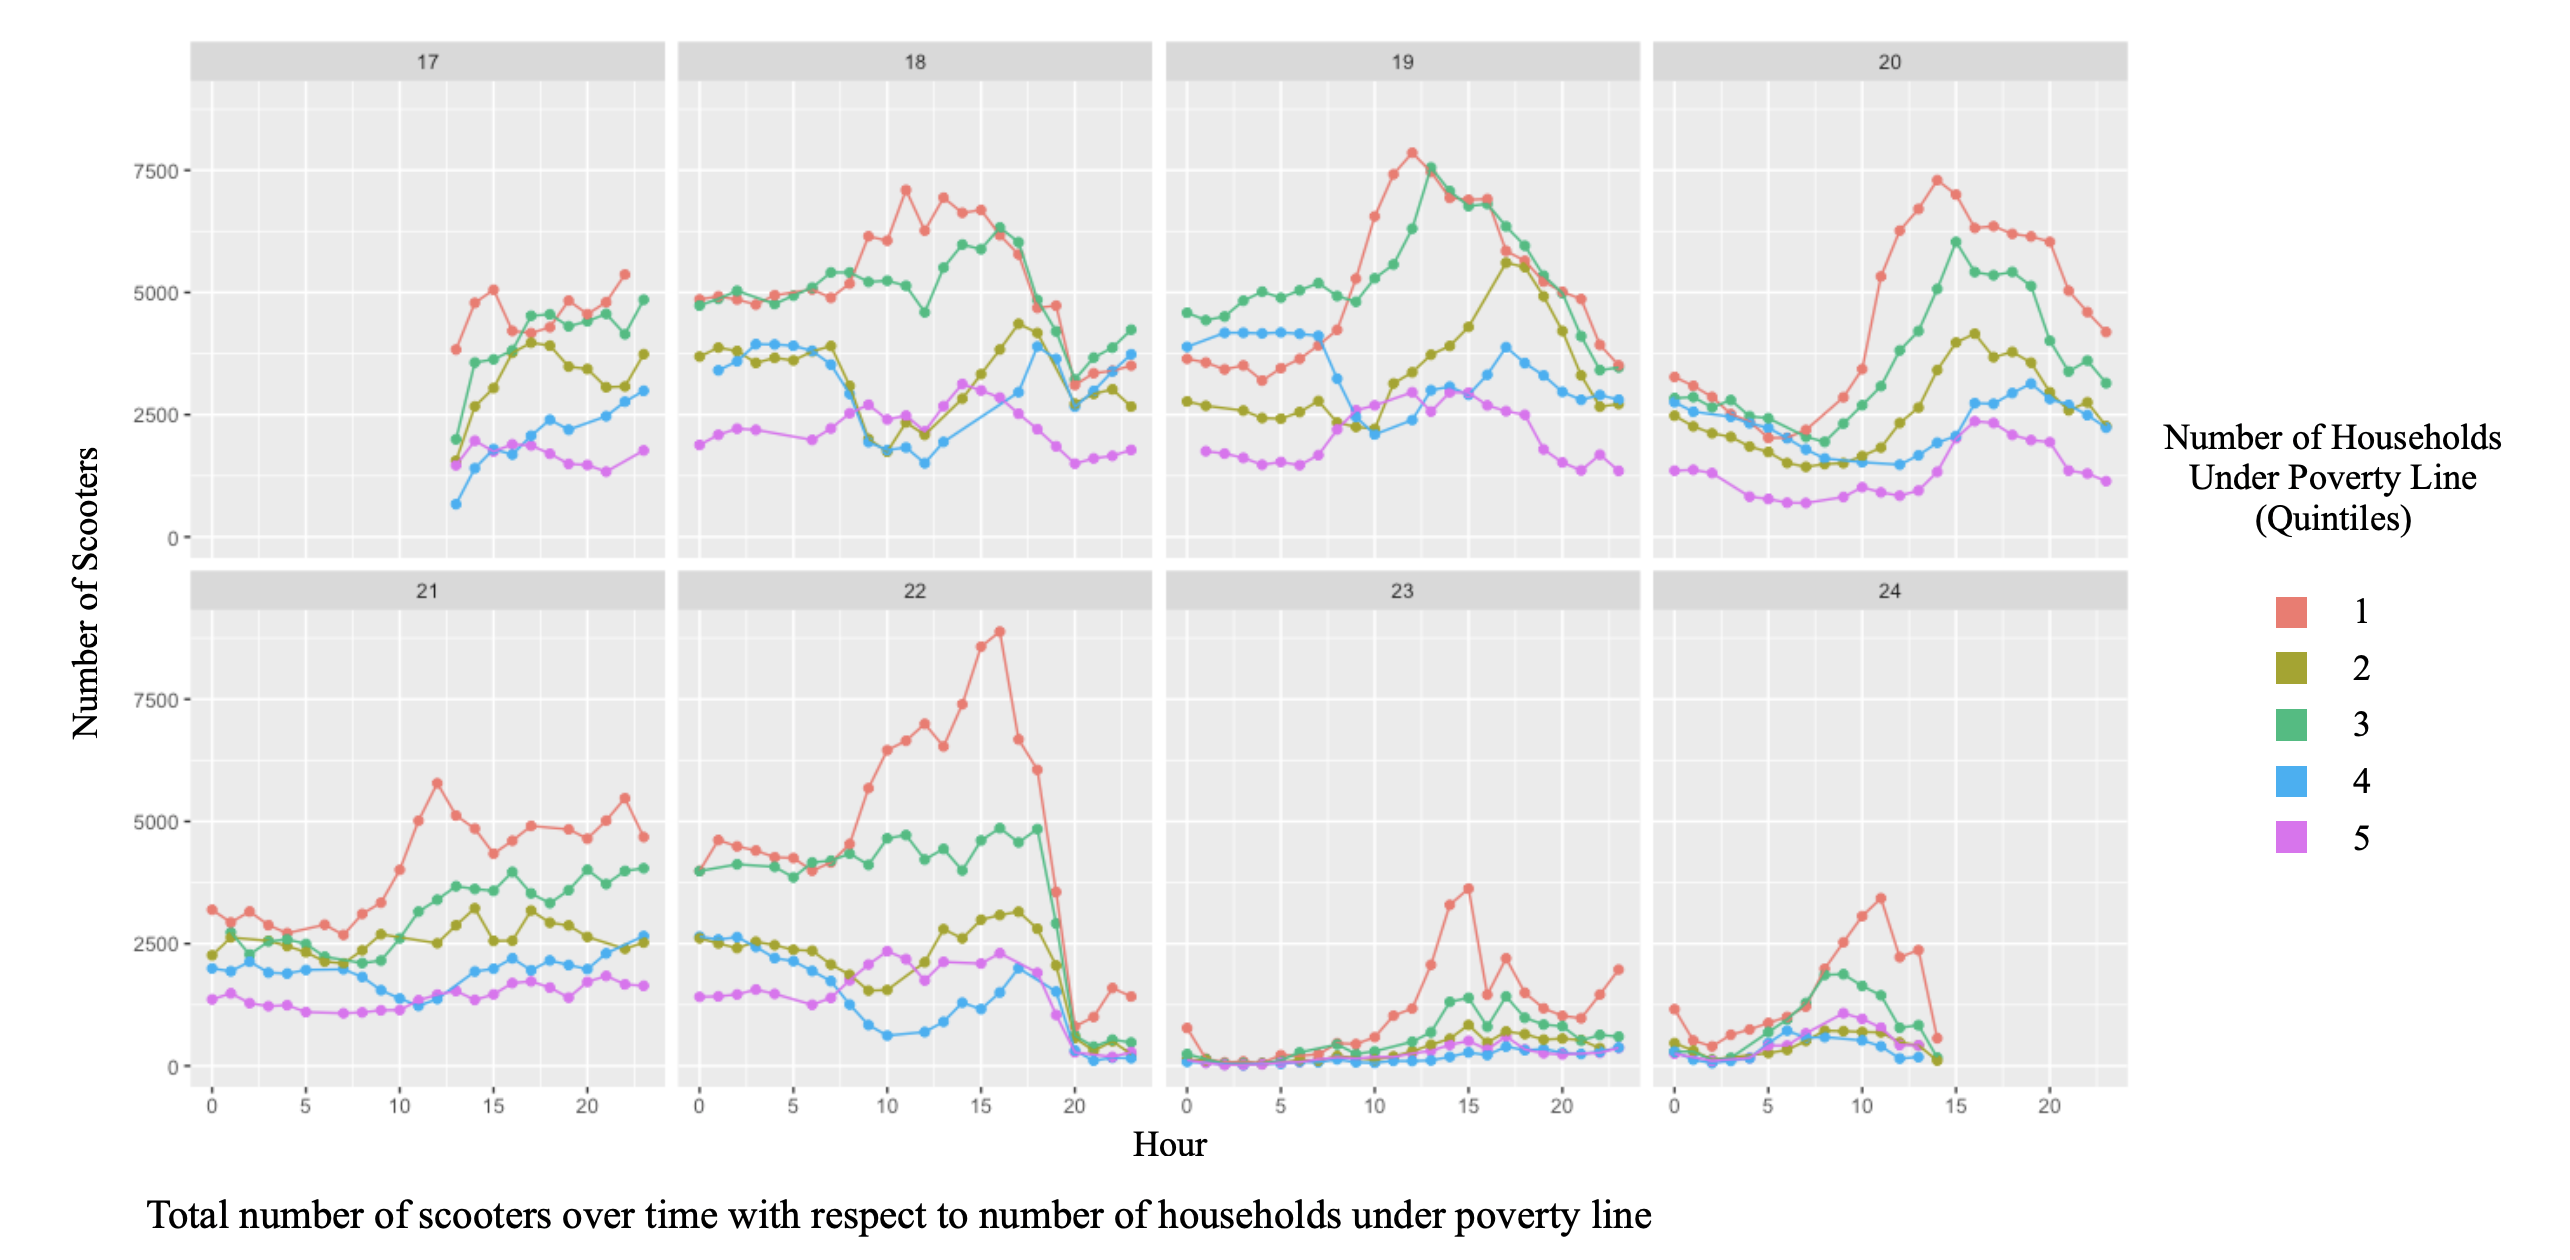
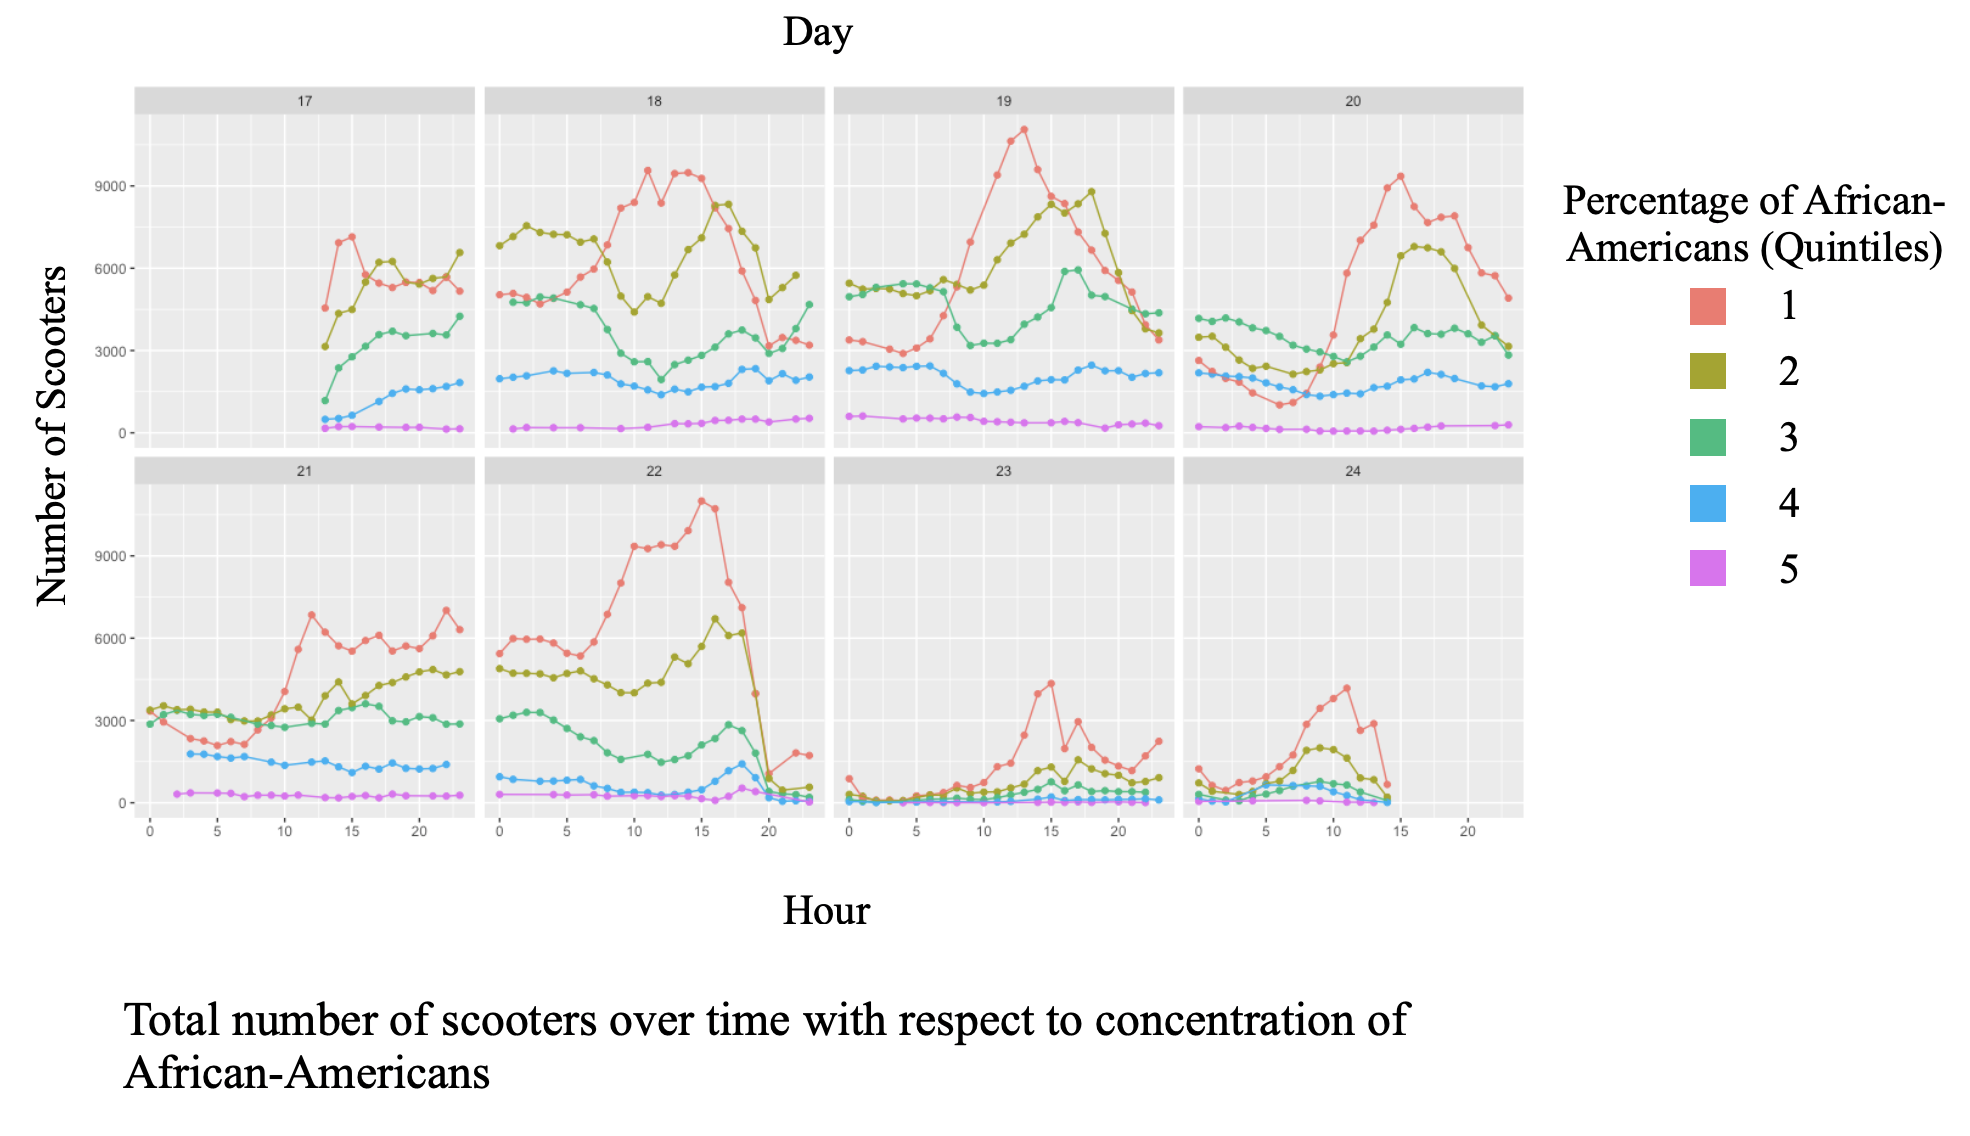
In the temporal plots, we see, with very little exception, the census tracts in the upper 40% of African-American population have the least e-scooter activity over the course of the day. Poverty again shows a less distinct trend with e-scooter activity.
Also notable is that the census tracts with fewer African-Americans and/or less poverty follow different usage patterns. They tend to peak in e-scooter activity during midday, while census tracts with greater concentrations of African-Americans and greater poverty levels decrease in e-scooter activity during midday. This indicates that scooters are leaving census tracts with more African-Americans during peak usage times.
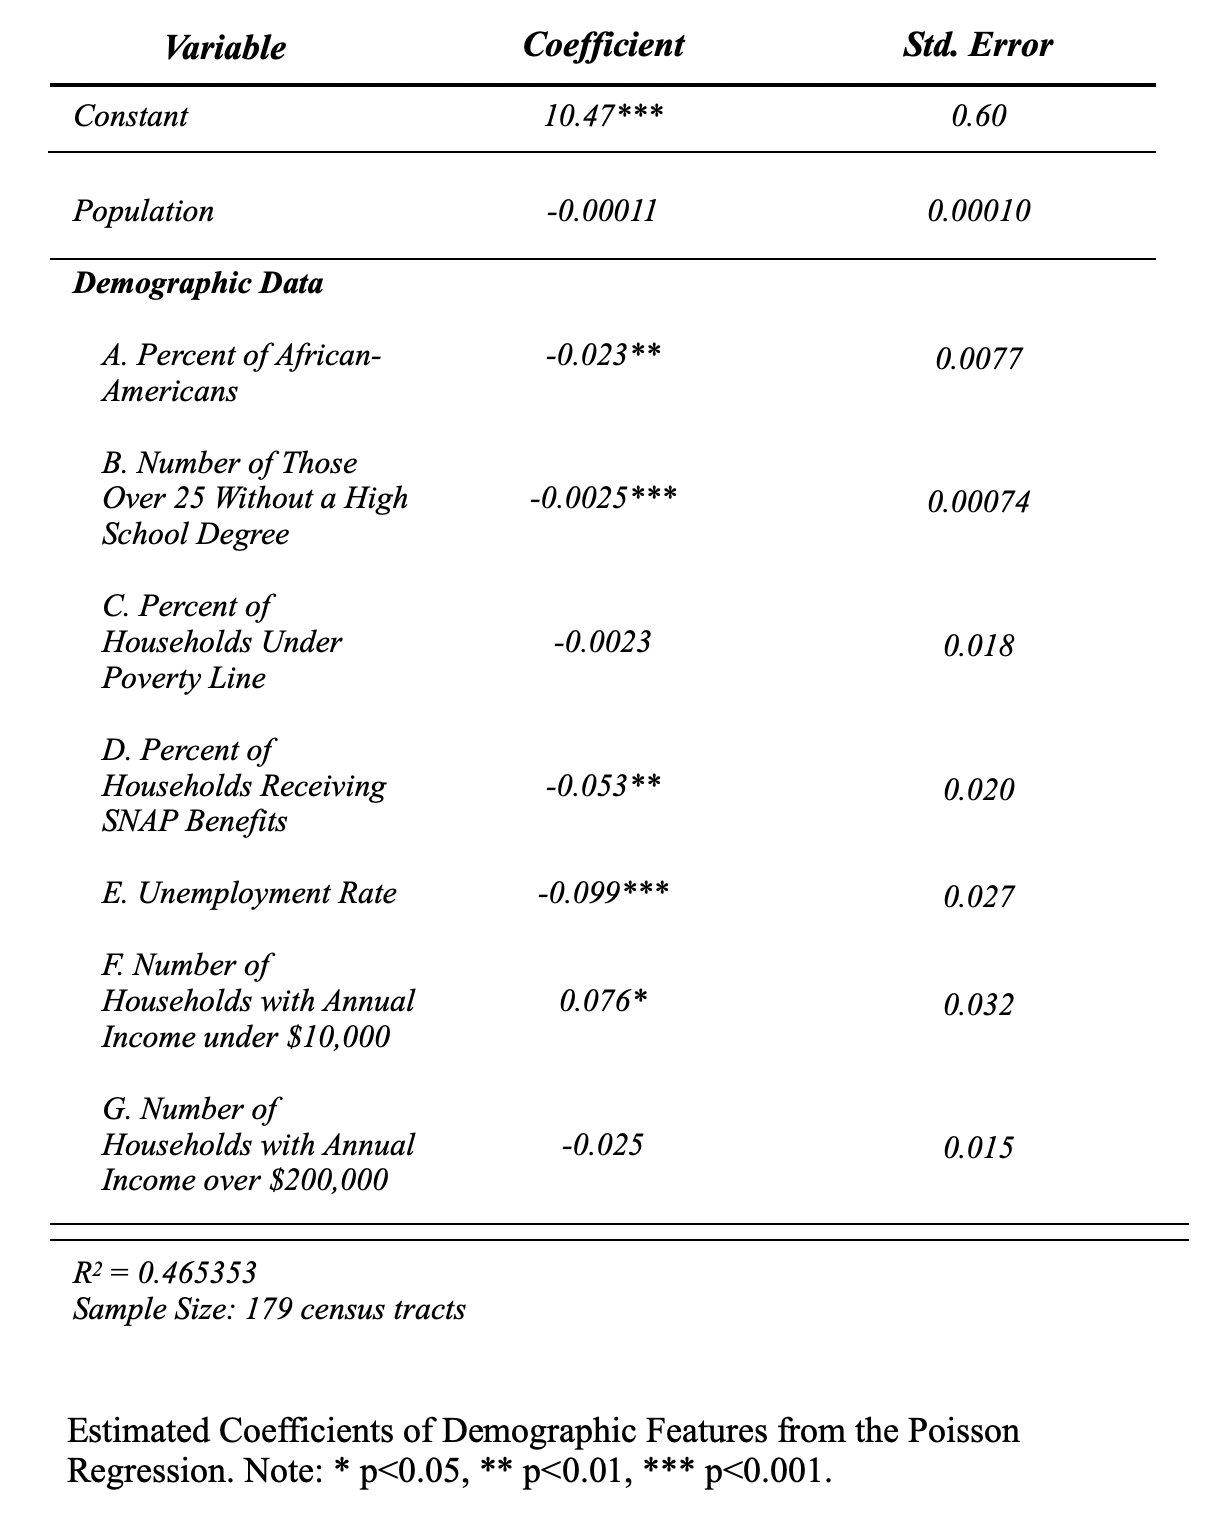 As shown in the table, employment and education level are statistically significant, which is to be expected. However, percent of African-Americans is also statistically significant, which is disappointing since race should logically have no bearing on e-scooter availability.
This research is just a small look into racial discrimination (whether intentional or not) in micromobility. I found similar trends in both relocation trips and consumer-ride trips, indicating that companies may be intentionally moving scooters away from areas with greater numbers of African-Americans.
In the future, it would be ideal to analyze data from multiple cities over a longer period of time to confirm the generality of our conclusions.
DuPuis, N., Griess, J., & Klein, C. (2019). Micromobility in Cities: a History and Policy Overview. Retrieved from National League of Cities website: https://www.nlc.org/resource/micromobility-in-cities-a-history-and-policy-overview McKenzie, G. (2019). Spatiotemporal comparative analysis of scooter-share and bike-share usage patterns in Washington, D.C. Journal of Transport Geography, 78, 19–28. https://doi.org/10.1016/j.jtrangeo.2019.05.007