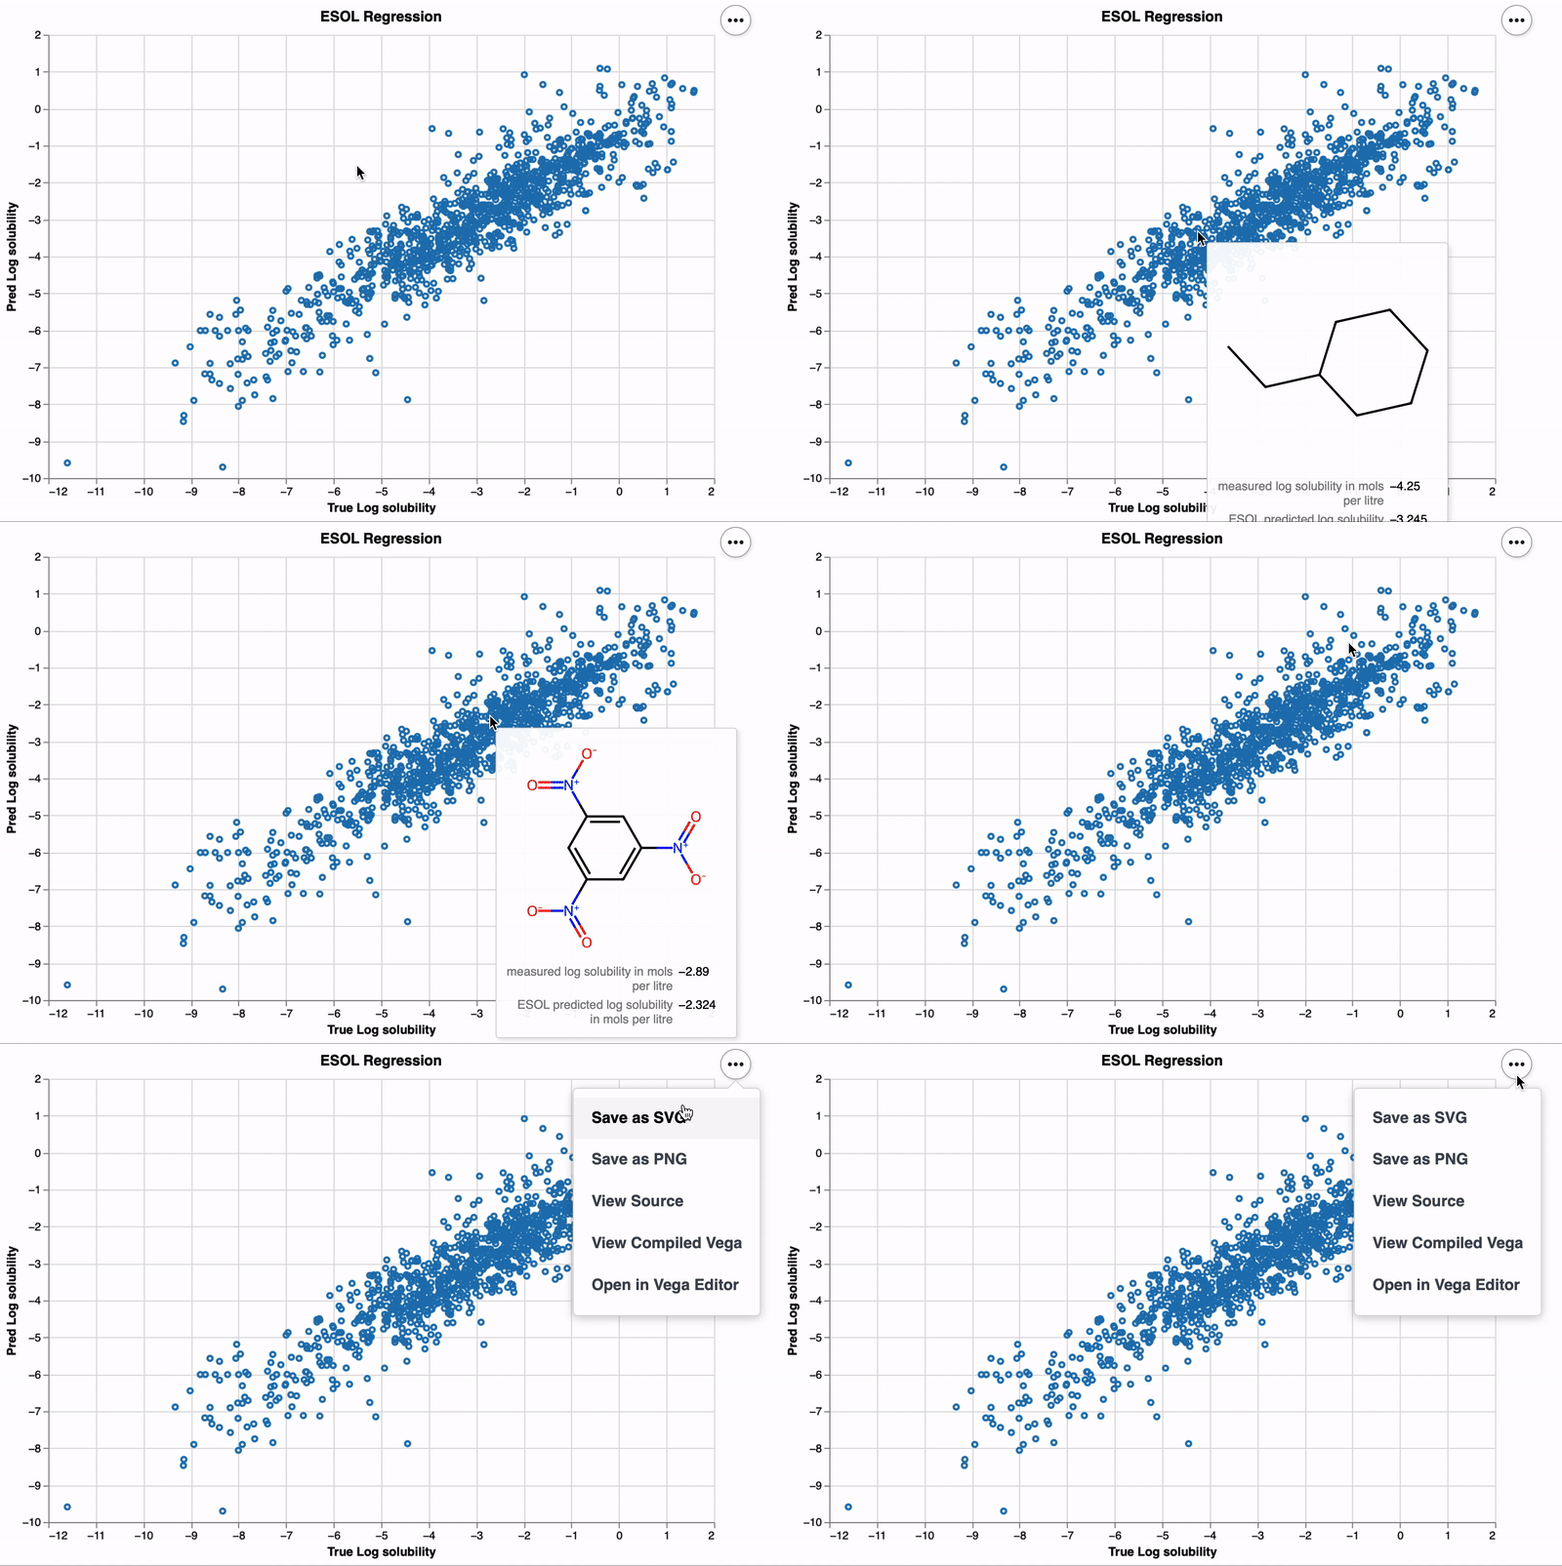
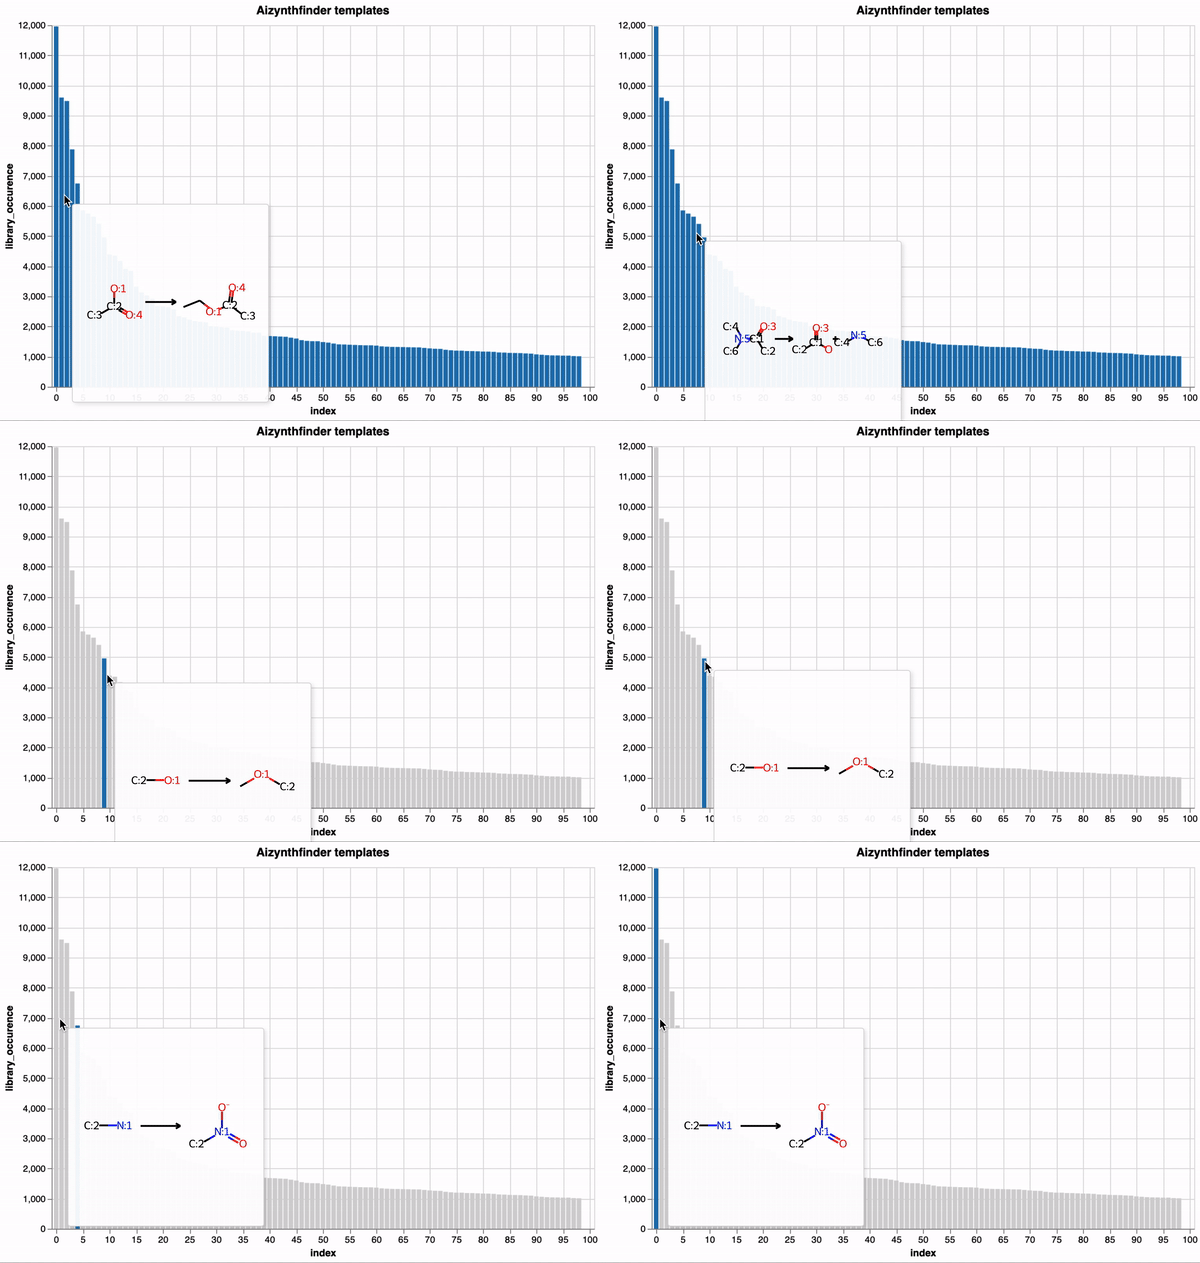
altmol enhances Altair visualizations by integrating interactive 2D molecular structures,
leveraging RDKit for rendering.
This package is inspired by the capabilities of molplotly.
altmol can be easily installed using pip or poetry, accommodating both traditional and modern Python workflows.
pip install altmolIf you're managing your project with Poetry, add altmol to your project using:
poetry add altmolAlternatively, you can manually add it to your pyproject.toml and then install it using:
poetry installTo get started with altmol, ensure you have Altair and RDKit installed in your environment.
Here's a simple example to illustrate how to create an interactive scatter plot with molecule visualizations:
import altair as alt
import pandas as pd

from altmol.plot import chem_plot
from altmol.chem import encode_molecules

# URL of the ESOL dataset
url_esol = 'https://raw.githubusercontent.com/deepchem/deepchem/master/datasets/delaney-processed.csv'

# Load your dataset
df = pd.read_csv(url_esol)

# Prepare your data (ensure you have a 'smiles' column for molecular structures)
df = encode_molecules(df, smiles_col_name='smiles', img_format='svg')

x_col_name = "measured log solubility in mols per litre"
y_col_name = "ESOL predicted log solubility in mols per litre"

# Generate and display the interactive plot
chart = chem_plot(
    df,
    x_axis=alt.X(f"{x_col_name}:Q", title="True Log solubility"),
    y_axis=alt.Y(f"{y_col_name}:Q", title="Pred Log solubility"),
    tooltip=[x_col_name, y_col_name],
    selector=False,
    interactive=False,
    title="ESOL Regression"
)
chart.display()Contributions to altmol are welcome! Whether it's bug reports, feature requests,
or contributions to the code, we value your input.
altmol is released under the MIT License. See the LICENSE file for more details.
altmol is built upon the powerful capabilities of RDKit
and Altair, and we are grateful to the developers and contributors of these projects.


