Store and display microservice dependency graph.
It's responsible for receive microservices data and returns that data in a graph format to be displayed by the Service Viewer project. All data is stored using the current time as an identification, so this way is possible to view data trough time.
This data in JSON format is sent through a HTTP POST to /calling URI, and it's represented by:
- Caller Name (Microservice that performs the call)
- Called Name (Microservice that receives the call)
- Called Endpoint Name (Microservice's endpoint that receives the call)
Example:
{
  "serviceCaller":"checkout",
  "serviceCalled":"users",
  "endpointCalled":"findById"
}
Important Note: this process return 200 (OK) instantly (it's basically a request and forget method), this way the clients don't need to wait for the whole process to be executed.
It requires a Redis instance running locally.
$ sbt testIt requires a Redis instance running locally.
$ sbt runcurl command is required to run this script.
Please, do not forget to run the service-stats through SBT before executing this script.
Just run the script:
$ ./insert-dummy-data.shIt will perform some HTTP post requests to http://localhost:8080, after that you can see the graph using the service-viewer project.
- Scala language
- Akka HTTP
- Scalatest
- Redis (rediscala)
All data is stored into Redis using HASH format to represent graph data.
The key for Node/Vertex is nodes:HH.mm (HH is the hour and mm is the minute). Example: nodes:17.41
The key for Link/Edge is edges:HH.mm (HH is the hour and mm is the minute). Example: edges:17.41
Each edge contains a value that represents how many requests it received at a specific time, and it can be visualized as a label rep/min by the service-viewer graph).
The node's index is generated by a Redis String using the inc command.
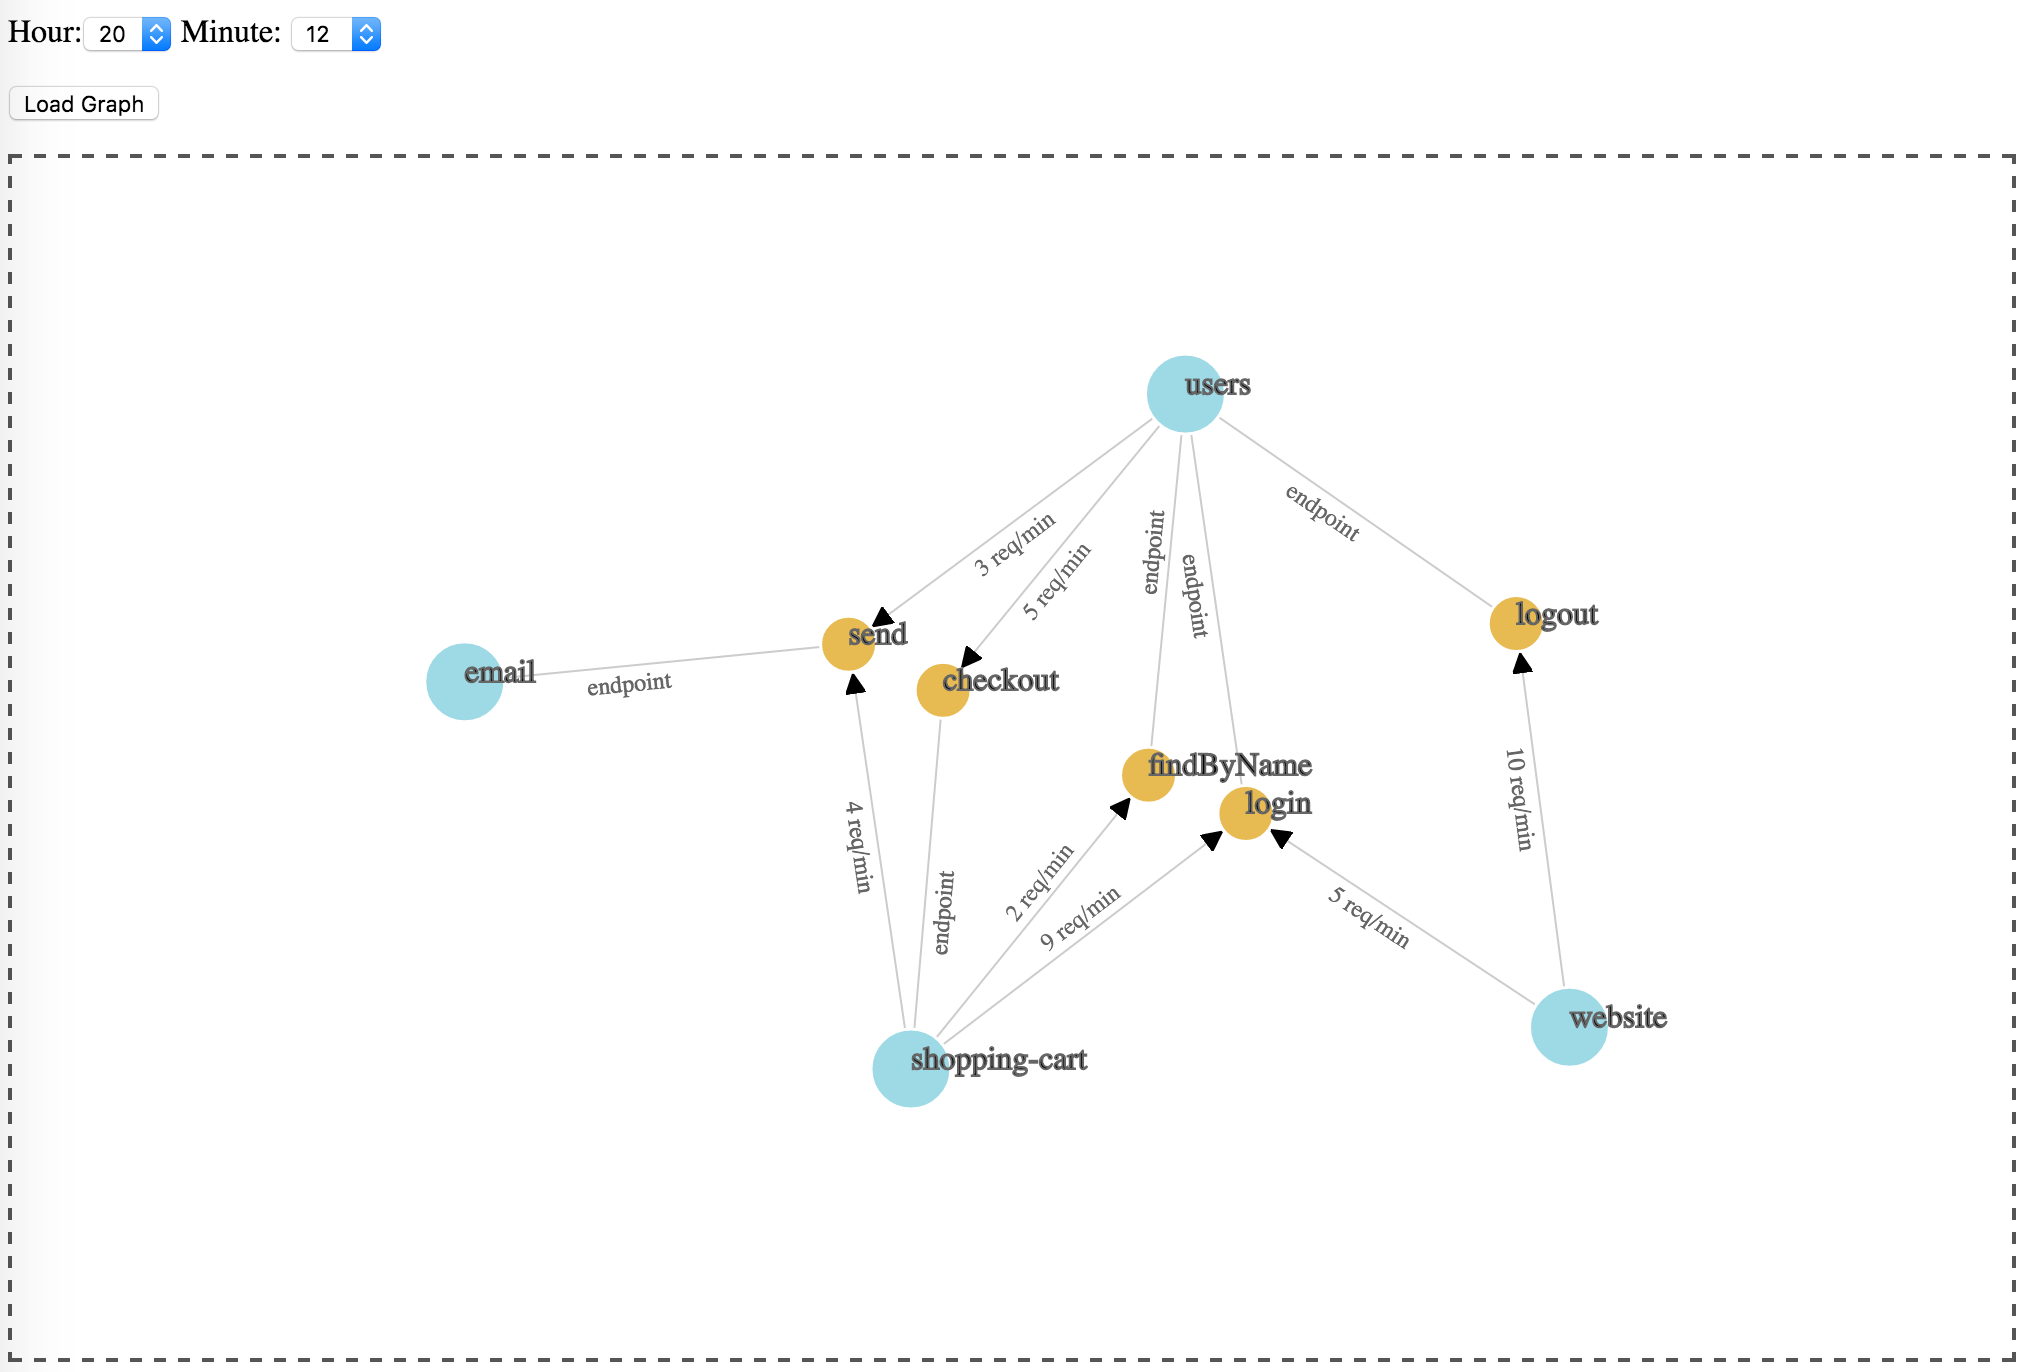
Currently is only possible to display a graph for a specific time (hour:minute).
As it does not intend to be a time series graph, it would be good to determine how many time all data that represents a specific time will be available. Adding TTL to those data could fix that issue, so this way there'll be no conflict among dates.
It's responsible for displaying the graph in a browser.
It's just an HTML file (service-viewer/index.html) that you can open directly in your browser.
This HTML uses: Jquery and D3.js
Example: