This project analyses publicly available data on the COVID-19 pandemic and identifies trends and patterns using the pandas data analysis framework.
- The project is written as a Jupyter notebook using pandas here. Github will render a static version. If you want to execute the notebook dynamically, you will need to download it locally (see instructions below).
- A HTML version is updated on an hourly basis here
- A basic dashboard only including main graphs is updated hourly here
Examples of graphs that are produced:
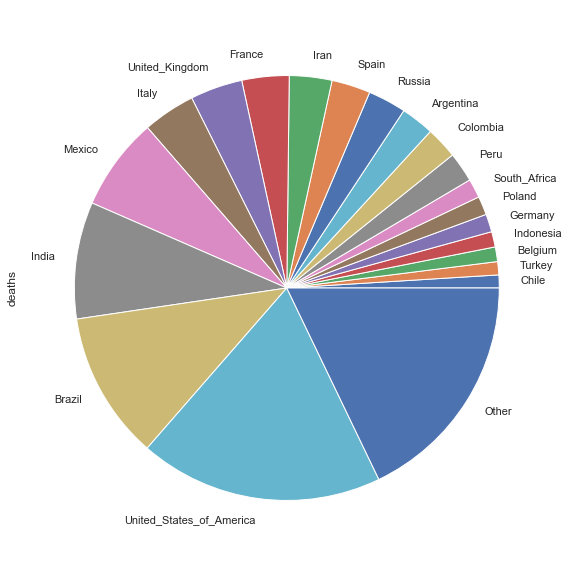
Countries With Highest Number Of Recorded Covid-19 Deaths Vs Rest Of World
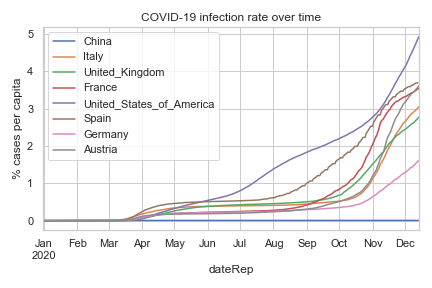
Covid-19 Infection Rate Over Time
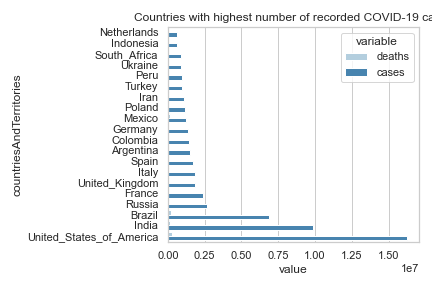
Countries With Highest Number Of Recorded Covid-19 Cases
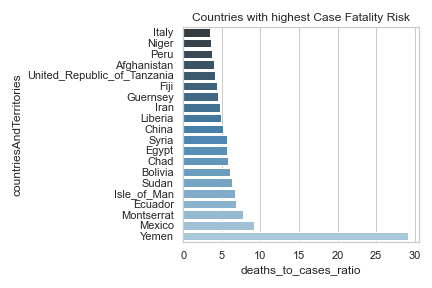
Countries With Highest Case Fatality Risk
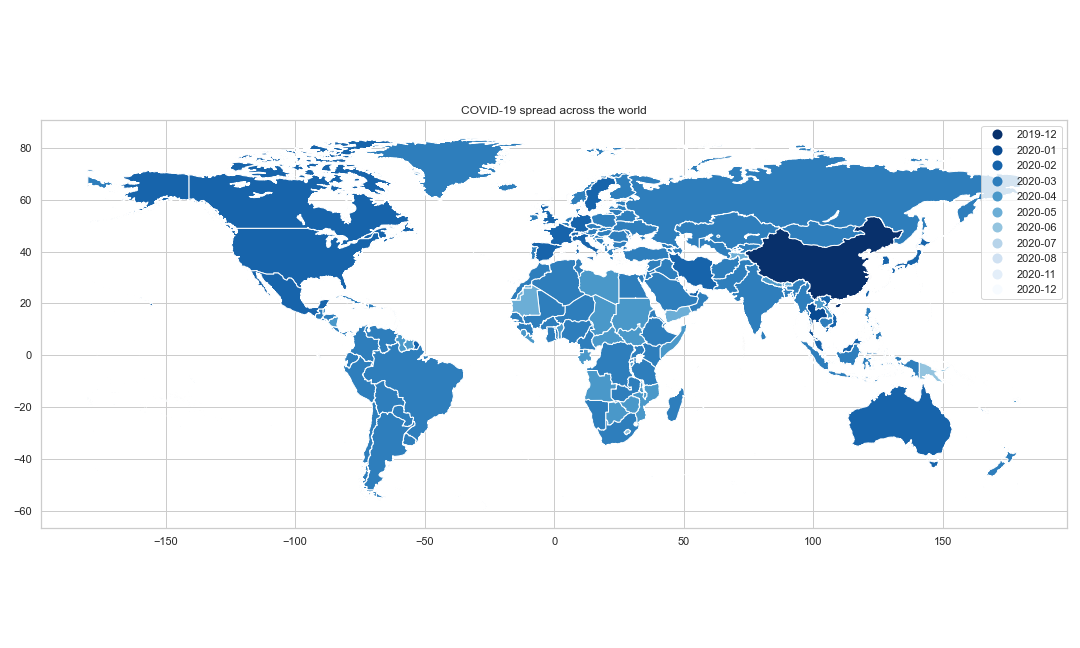
COVID-19 Spread Across The World
The data runs inside a Jupyter notebook. Make sure you install the core Jupyter runtime as well as the following libraries:
- pandas - the core data manipulation
- sklearn (optional) - was used for normalisation scaling but no longer needed
- matplotlib - for plotting the data
- xlrd - used by pandas to read the raw data in Excel
- geoplot - used to draw world maps
- pyyaml - used to generate some data files in YAML format for the Jekyll web site
- seaborn - improves the look and feel of the graphs
You will need to install proj and ````geosin order to use thecartopy``` framework (used to generate the nice world map):
brew install proj geos
Then install the python libraries via pip:
pip install -r requirements.txt
To run the notebook in interactive mode, launch it with:
jupyter notebook covid.ipynb
This will start the Jupyter server and open the notebook in a browser window. Press the 'h' key to get help on using Jupyter.
To execute the notebook in non-interactive mode (i.e. to just force a download of the latest data, re-generate the graphs and save a HTML file), type:
jupyter nbconvert --to html --execute --ExecutePreprocessor.timeout=-1 covid.ipynb
This will execute the notebook silently and create a covid.html file as output.
All the graphs will be updated in the graphs folder.