OliveR is an R package containing a shiny application that provides a vast series of statistical tools for exploring and analyzing both quantitative (such as morphometric or biochemical) and genetic data that can be associated to geographical coordinates. Through the use of shapefiles, the application allows visualizing both data and results of a statistical analysis directly on a geographical basis.
It is a general-purpose interactive application that makes available several functions for explorative data analysis as well as several standard methods for multivariate statistics (such as Linear models, Principal Component Analysis, Cluster analysis, etc.) and therefore guides the user in visualizing, exploring and analyzing the data by a simple point-and-click approach.
In brief, OliveR contains the following main functionalities:
- Interactive explorative graphics, with scatter plots, barplots, boxplots and geographical plots;
- One way ANOVA (and Bonferroni post hoc test);
- Principal Component Analysis;
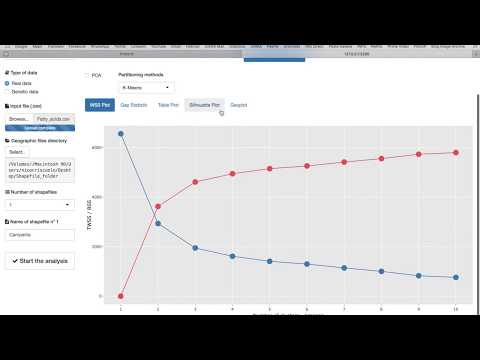
- Cluster analysis (hierarchical clustering, K-means, PAM, and methods for assessing cluster quality such as silhouette coefficient and adjusted rand index);
- Mantel test.
You can install the released version of OliveR from GitHub with:
install.packages(pkgs = "devtools")

library(devtools)

install_github(repo = "nicocriscuolo/OliveR", dependencies = TRUE)
Once the package is loaded and the dependencies installed, you can run the software in the default browser through the following functions:
library(OliveR)

runOliveR()
OliveR 0.1.0 works on all types of browsers (Internet Explorer, Safari, Chrome, etc.) and in its current version, if you do not use the features of Google Maps, it can also work locally and then offline. All you have to do is to install the updated versions of R (>= 3.5) and RStudio.
If you have trouble installing OliveR, you can follow the instructions present in the file at this link.
In this first version, to use the software, you need to import two types of files:
-
a user-defined .csv file: the first four columns must contain the statistical variables that indicate, in order, the identifier of the sample, the group to which it belongs, and the UTM East and North coordinates; therefore the names of these 4 columns are: “Sample_ID”, “Label”, “UTM_Est”, “UTM_Nord”. The following columns are dynamic and must contain the variables on which the user wants to perform the analyzes. These columns may contain either data of a continuous nature or data of the weight in bp (base pairs) of microsatellite loci (SSRs): in the latter case each column is defined by the name of the locus and must contain the values of the two alleles (diploid organism) divided by the symbol “/”;
-
a shapefile (.shp) on which to display the spatial arrangement of the samples. The shapefile must be inside a folder (local path on the user’s computer) in which there are also all the accessory files that are generally associated with a shapefile and that allow its operation (as in the GIS software) such as .cpg, .dbf, .prj, .sbn, .sbx, .shx.
Below is a link to the YouTube video of the application showing an example of using the software:
If you have a Google API to use the maps, you can view the disposition of your samples, and the information associated with it, including through the Google Maps software. You can generate your API key at any time to access the software within the Google Cloud Platform and display the map directly on OliveR.


Examples of the .csv files that you can import into OliveR are present at the following link of the repository: CSV data. Depending on the type of .csv file that will be imported, you will be able to take advantage of different software features. To download an example folder with geo-spatial files related to the .csv data present in this repository, please visit the following link: shapefile data.
OliveR was designed to analyze data of a continuous and genetic (SSRs) nature obtained from samples that are spatially distributed in a given geographical area, to quantify the differences in morphometric, biochemical and genetic parameters. Its first use, from which the name derives, was made on olive trees present in the south of Italy. The results of the data analysis done on the sample datasets available in this repository have been included in our publication. If you use this package in your paper, please cite:
- Criscuolo, N., Guarino, F., Angelini, C., Castiglione, S., Caruso, T., Cicatelli, A. High Biodiversity Arises from the Analyses of Morphometric, Biochemical and Genetic Data in Ancient Olive Trees of South of Italy. Plants, 2019, 8, 297.
For additional information regarding OliveR, please consult the documentation or email us.