An arduino EEG interface designed to enable lucid dreaming
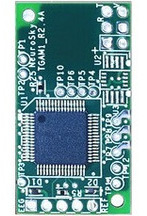
After seeing the movie Inception, I was inspired to try and build a lucid dreaming device. I decided to take advantage of low cost, commercially available EEG chips which were being incorporated into toys, such as the NeuroSky EEG module (pictured below). Using these off-the-shelf devices it is possible to extract low quality EEG signals and perform FFT processing to determine the dominant power spectrum and use that to (indirectly) monitor sleep stage. By detecting the change in EEG pattern it is theoretically possible to detect the onset of dreaming. If the system detects the onset of REM sleep, it plays an audible tone, which (with practice/training) can help the user recognize that they are dreaming, facilitating lucid dreaming.
The system consists of
- a Force Trainer or Mindflex EEG module is connected to an arduino via an optoisolator.
- The arduino uses the brain library to extract EEG data as it listens to the tx/rx pins.
- the arduino displays the power spectrogram on the attached LCD display
- when the EEG spectrum changes from delta wave predominant (suggesting slow wave sleep) to alpha wave predominant (suggesting either wakefullness or REM) the device emits a tone (or better yet plays the song “Non, je ne Regrette Rien”) which can indicate to the user that they are dreaming
- the device also logs data to an SD card for review

Definitions and interpretation of EEG power spectra:
| Phase | Frequency | Significance |
|---|---|---|
| Delta | 1-3 Hz | sleep |
| Theta | 4-7 Hz | relaxed |
| Alpha | 8-12 Hz | eyes closed |
| Beta | 13-30 Hz | eyes open |
| Gamma | 31-50 Hz | concentration |

- wiring diagram; green wires denote LCD connections, yellow denote EEG connection, red/black denote speaker connection *
The code uses the Brain and LiquidCrystal libraries.
It collects EEG data for each power spectra and averages it over several seconds. It displays the average data on the LCD display using custom characters to form a bar graph.
(in progress) It averages EEG data over 30 seconds to define an epoch and compares adjacent epochs to look for a change in sleep stage.
(in progress) If a change in status from delta to beta wave predominant is identified suggesting the onset of REM sleep it generates a tone to alert the user and facilitate lucid dreaming.
// *
// EEG analysis of Mindflex EEG data
// v1.5 - with LCD bar graph output and rudimentary data smoothing
// by Nick Mark
// *

// include the LCD and Brain libraries
#include <LiquidCrystal.h>
#include <Brain.h>

// activate the Brain serial port connection
Brain brain(Serial);

// configure variables for the EEG data
byte signalStrength = 0;
long deltaEnergy = 0;
long alphaEnergy = 0;
long betaEnergy = 0;
long thetaEnergy = 0;

// create arrays for data smoothing; numReadings defines the number of values to smooth together
const int numReadings = 3;
int index = 0;
long readingsDelta[numReadings];
long totalDelta = 0;
long averageDelta = 0;
long readingsAlpha[numReadings];
long totalAlpha = 0;
long averageAlpha = 0;
long readingsBeta[numReadings];
long totalBeta = 0;
long averageBeta = 0;
long readingsTheta[numReadings];
long totalTheta = 0;
long averageTheta = 0;

// create array for long duration monitoring

// activate and configure the LCD             pin 12 =      pin 11 =       pin 10 =       pin 5 =
LiquidCrystal lcd(12, 11, 10, 5, 4, 3, 2); //  pin 4 =       pin 3 =        pin 2 =
int backLight = 13;

// create the custom characters for the LCD bar-graphs
uint8_t custom_0[8] = { 0x00, 0x00, 0x00, 0x00, 0x00, 0x00, 0x00, 0x1f}; //1 bar
uint8_t custom_1[8] = { 0x00, 0x00, 0x00, 0x00, 0x00, 0x00, 0x1f, 0x1f}; //2 bar
uint8_t custom_2[8] = { 0x00, 0x00, 0x00, 0x00, 0x00, 0x1f, 0x1f, 0x1f}; //3 bar
uint8_t custom_3[8] = { 0x00, 0x00, 0x00, 0x00, 0x1f, 0x1f, 0x1f, 0x1f}; //4 bar (half)
uint8_t custom_4[8] = { 0x00, 0x00, 0x00, 0x1f, 0x1f, 0x1f, 0x1f, 0x1f}; //5 bar
uint8_t custom_5[8] = { 0x00, 0x00, 0x1f, 0x1F, 0x1F, 0x1F, 0x1F, 0x1f}; //6 bar
uint8_t custom_6[8] = { 0x00, 0x1F, 0x1F, 0x1F, 0x1F, 0x1F, 0x1F, 0x1f}; //7 bar
uint8_t custom_7[8] = { 0x1f, 0x1F, 0x1F, 0x1F, 0x1F, 0x1F, 0x1F, 0x1f}; //8 bar (full)

// configure remainders for bar graph
int remSigStrength = 0;
int remDelta = 0;
int remAlpha = 0;
int remBeta = 0;
int remTheta = 0;

void setup(){
  // initialize the data smoothing array and set contents equal to zero
  for (int thisReading = 0; thisReading < numReadings; thisReading++) {
    readingsAlpha[thisReading] = 0;
    readingsDelta[thisReading] = 0;
    readingsBeta[thisReading] = 0;
    readingsTheta[thisReading] = 0;
    }

  // active the serial connection to the computer
  Serial.begin(9600);
  Serial.println("connection established");

  // activate the LCD and set up the LCD backlight
  pinMode(backLight, OUTPUT);
  digitalWrite(backLight, HIGH);
  lcd.begin(16, 2);
  lcd.print("ready...");

  // define the custom characters for the LCD controlled
  lcd.createChar(0, custom_0); //send the custom characters to the LCD
  lcd.createChar(1, custom_1);
  lcd.createChar(2, custom_2);
  lcd.createChar(3, custom_3);
  lcd.createChar(4, custom_4);
  lcd.createChar(5, custom_5);
  lcd.createChar(6, custom_6);
  lcd.createChar(7, custom_7);
}

void loop(){
  if (brain.update()){
    // calculate values for the data smoothing array
    totalDelta = totalDelta - readingsDelta[index];
    readingsDelta[index] = (brain.readDelta() + brain.readDelta());
    totalDelta = totalDelta + readingsDelta[index];
    totalAlpha = totalAlpha - readingsAlpha[index];
    readingsAlpha[index] = (brain.readLowAlpha() + brain.readHighAlpha());
    totalAlpha = totalAlpha + readingsAlpha[index];
    totalBeta = totalBeta - readingsBeta[index];
    readingsBeta[index] = (brain.readLowBeta() + brain.readHighBeta());
    totalBeta = totalBeta + readingsBeta[index];
    totalTheta = totalTheta - readingsTheta[index];
    readingsTheta[index] = (brain.readTheta());
    totalTheta = totalTheta + readingsTheta[index];

    index = index + 1;

    // calculate 3 second averages based on the array
    averageDelta = totalDelta / numReadings;
    averageAlpha = totalAlpha / numReadings;
    averageBeta = totalBeta / numReadings;
    averageTheta = totalTheta / numReadings;

    // reset the position in the array
    if (index >= numReadings)
      index = 0;

    // draw the screen labels
    lcd.clear();
    lcd.setCursor(0,0);
    lcd.print("S  D  A  B  T");

    // fill in the wavelength energies from the EEG reading
    lcd.setCursor(1,0);
    lcd.print(brain.readSignalQuality());
    lcd.setCursor(4,0);
    lcd.print(brain.readDelta()/75000);
    lcd.setCursor(7,0);
    lcd.print(averageAlpha/10000);
    lcd.setCursor(10,0);
    lcd.print((brain.readHighBeta()+brain.readLowBeta())/10000);
    lcd.setCursor(13,0);
    lcd.print(brain.readTheta()/5000);

    // normalize the variables and divide to create the bar graph values
    byte signalStrength = (((brain.readSignalQuality())/15)/8);
    unsigned long deltaEnergy = (((averageDelta)/150000)/8);
    unsigned long alphaEnergy = (((averageAlpha)/15000)/8);
    unsigned long betaEnergy = (((averageBeta)/15000)/8);
    unsigned long thetaEnergy = (((averageTheta)/10000)/8);
    int remSigStrength = (((brain.readSignalQuality())/15)%8);
    int remDelta = (((averageDelta)/150000)%8);
    int remAlpha = ((averageAlpha/15000)%8);
    int remBeta = (((averageBeta)/15000)%8);
    int remTheta = (((averageTheta)/10000)%8);

    // fill in the bar graphs
    lcd.setCursor(0,1);
    for (int i=0; i<signalStrength;i++) {
      lcd.print(7,BYTE);}           //print the number of solid blocks
    lcd.print(remSigStrength,BYTE); //print the remainder which is meter segments within character

    lcd.setCursor(3,1);
    for (int i=0; i<deltaEnergy;i++) {
      lcd.print(7,BYTE);}
    lcd.print(remDelta,BYTE);

    lcd.setCursor(6,1);
    for (int i=0; i<alphaEnergy;i++) {
      lcd.print(7,BYTE);}
    lcd.print(remAlpha,BYTE);

    lcd.setCursor(9,1);
    for (int i=0; i<betaEnergy;i++) {
      lcd.print(7,BYTE);}
    lcd.print(remBeta,BYTE);

    lcd.setCursor(12,1);
    for (int i=0; i<thetaEnergy;i++) {
      lcd.print(7,BYTE);}
    lcd.print(remTheta,BYTE);
  }
}- v1.0 - first version intended for realtime EEG analysis and display on LCD
- v2.x - subsequent versions adding epoch interpretation, tone generation, and data logging
- v3.x - production version resolving bugs
- bug: might need to smooth over longer interval (5 seconds instead of 3)
- bug: need to work on epoch determination and change detection module
- example video
- design and build 3d printed case for arduino/display/speaker
- idea for improved version: use a BT connection to an more sophisticated EEG monitor, such as the Muse Headband
- Arduino library for reading Neurosky EEG brainwave data
- Brain Hack
- NeuroSky EEG Module
- Lucid Scribe a similar project using code running on a PC