DofMap plotter
DofMapPlotter is a tool developed to address the following questions that appear rather frequently on the FEniCS Q&A forum:
- I have a Function
ufrom FunctionSpace(mesh, 'CG', 1) and I'd like to modify its value at the first mesh vertex butu.vector()[0]changes the function value at different vertex. Why is that? - How do I turn a CellFunction into a DG0 Function?
- Given a 2d mesh and a Function
ufrom VectorFunctionSpace, are the degrees of freedom(dofs) ofuin the first half ofu.vector()? - Any question where the answer is a reference to
vertex_to_dof_mapordof_to_vertex_map.
DOLFIN's DofMap class is at the heart of answers to all these questions. Broadly speaking, the class is responsible for deciding "where" dofs of given function space are located. While dofs may coincide with mesh entities (e.g. CG1 dofs being function evaluations at mesh vertices coincide with mesh vertices) numbering of the two is different in general. DofMapPlotter highlights the difference between these numberings by letting user plot the mesh entity numbering alongside the dof numbering.
The following code illustrates how DofMapPlotter can be used to answer question 1.
from dolfin import *
from fenicstools import DofMapPlotter
mesh = UnitSquareMesh(5, 5)
V = FunctionSpace(mesh, 'CG', 1)
dmp = DofMapPlotter(V)
dmp.plot()
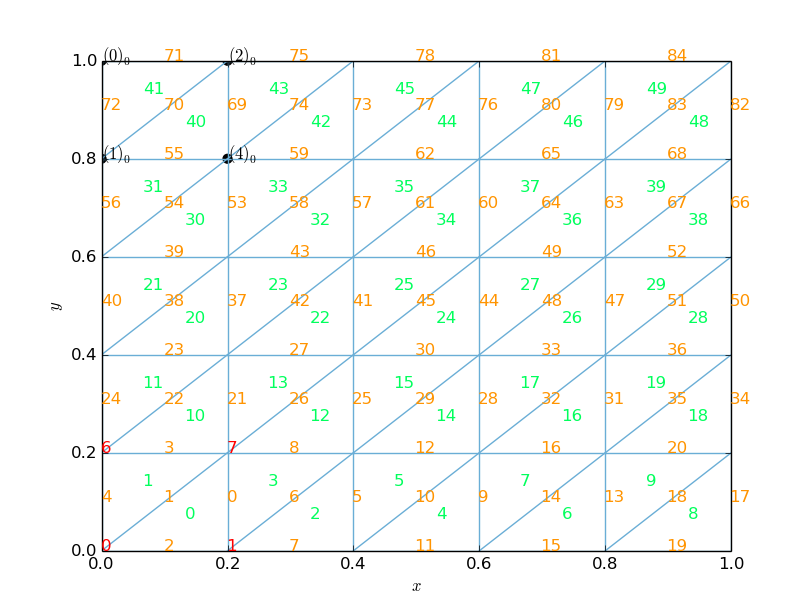
dmp.show()Pressing C, E, v with mouse hovering over cells 0 and 1 and d with mouse over cell 40 and 41 will light
up cell and edge indices for the entire mesh and vertex and dof indices in cells 0, 1 and
40, 41 respectively. Thus we see that first mesh vertex is located at [0, 0] while the first dof is located
at [0, 1]. The assignement u.vector[0] thus modifies the function's value at [0, 1].
To answer question 3 with DofMapPlotter run
from dolfin import *
from fenicstools import DofMapPlotter
mesh = UnitSquareMesh(5, 5)
V = VectorFunctionSpace(mesh, 'CG', 1)
dmp = DofMapPlotter(V)
dmp.plot(0)
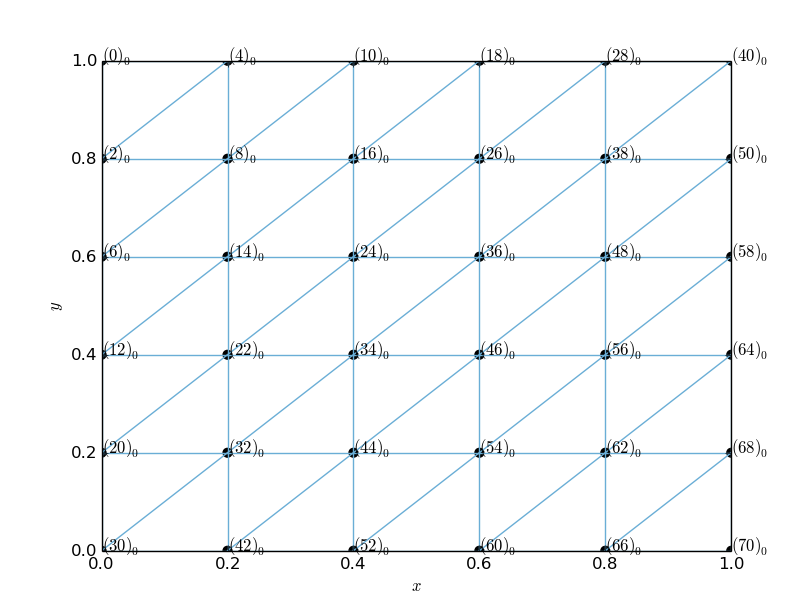
dmp.show()Pressing D with mouse in the figure results in the plot showing degrees of freedom of the first
component of the vector function space. We see that they are only even numbers, so they don't make
up first half of u.vector().
To conclude the showcase of DofMapPlotter, we explore dofs of a MixedFunctionSpace constructed from
Taylor-Hood P2-P1 elements.
from dolfin import *
from fenicstools import DofMapPlotter
domain = Rectangle(-1, -1, 1, 1)
mesh = Mesh(domain, 3)
V = VectorFunctionSpace(mesh, 'CG', 2)
Q = FunctionSpace(mesh, 'CG', 1)
M = MixedFunctionSpace([V, Q])
dmp = DofMapPlotter(M)
dmp.plot() # All dofs of M
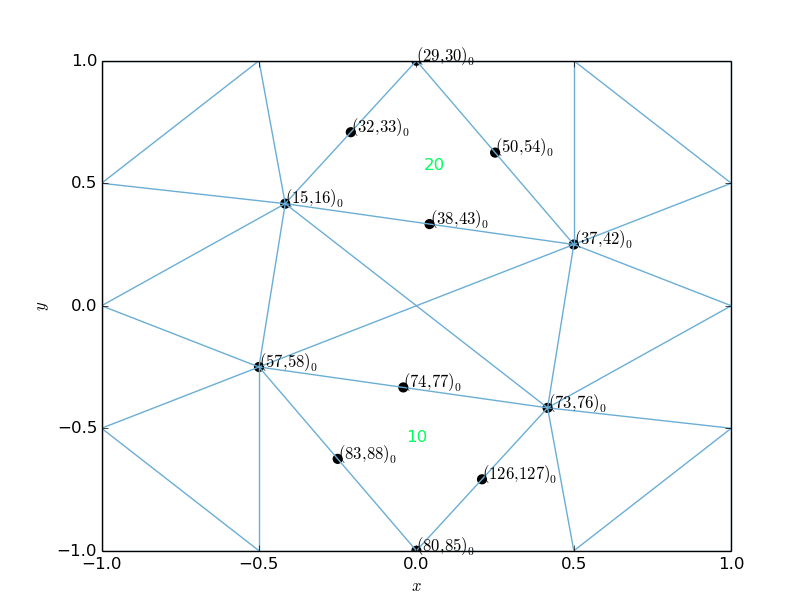
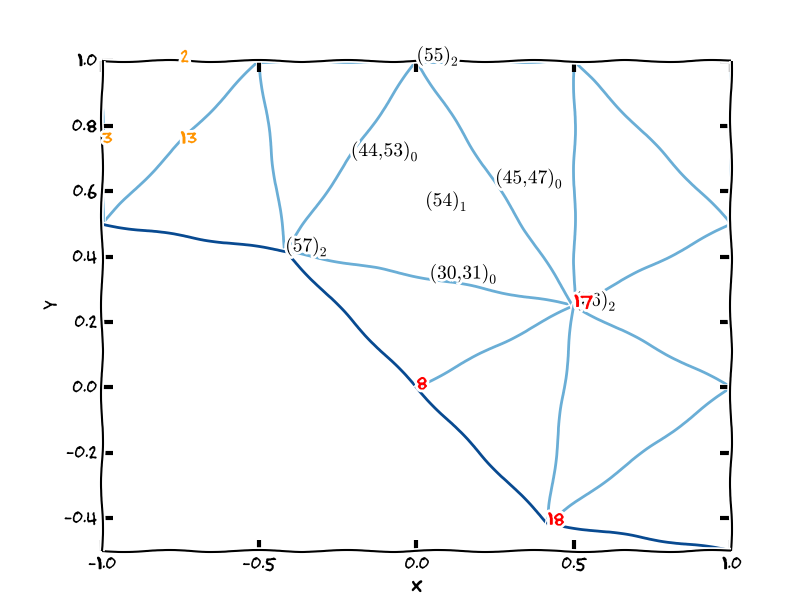
dmp.plot(sub=0) # Dofs of M that belong to V
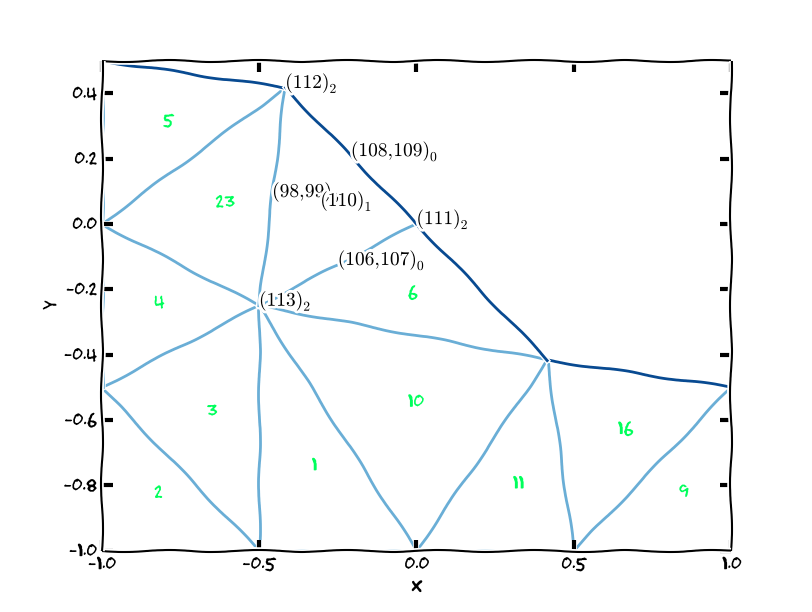
dmp.plot(sub=1) # Dofs of M that belong to Q
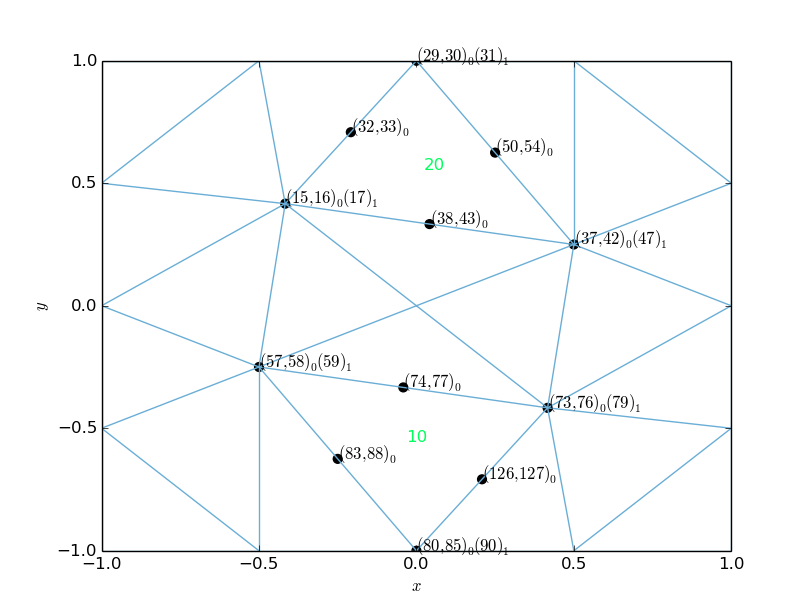
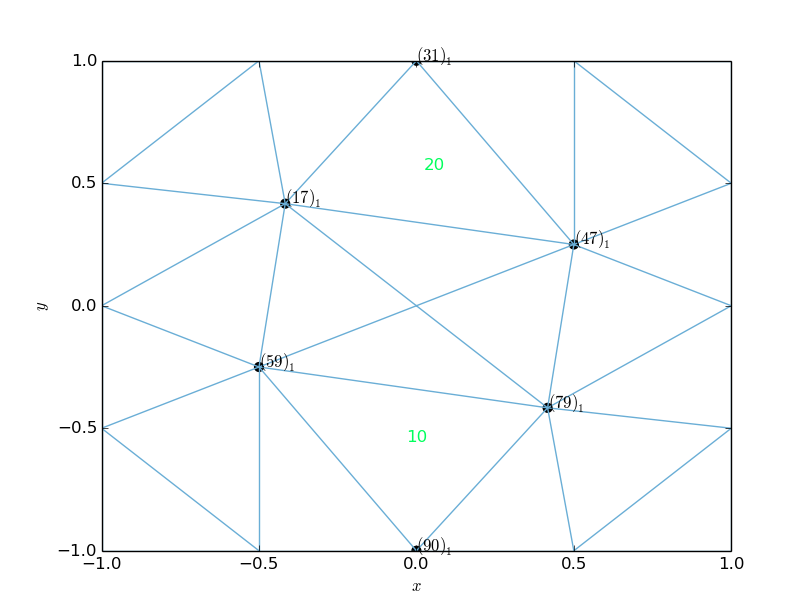
dmp.show()The first call to dmp.plot has no arguments and will give us all degrees of freedom of M. Thus we see
dofs clustering at vertices, for both CG2 and CG1 finite elements have dofs there.
Further use of DofMapPlotter is shown in demo_DofMapPlotter.py. Final word of warning. Unlike other tools from fenicstools collection, DofMapPlotter is not written for performance. Combining complex function spaces with large meshes can result in significant times required to render the plot.
Happy dofmap-plotting!
DofMapPlotter running in parallel with xkcd mode enabled.