An interactive data visualisation of City of Sydney transport data for first-year Computational Design
- Interpolation between absolute and relative mode of transport data as distance from the CBD changes (by Suburb)
- Visulised in 60fps on an HTML5 Canvas using p5.js, a JavaScript port of the Processing language
- Gulp.js build system
- Browsersync synchronized browser testing with live reload
- Live demo on Github Pages at https://jakecoppinger.github.io/transit-in-sydney/
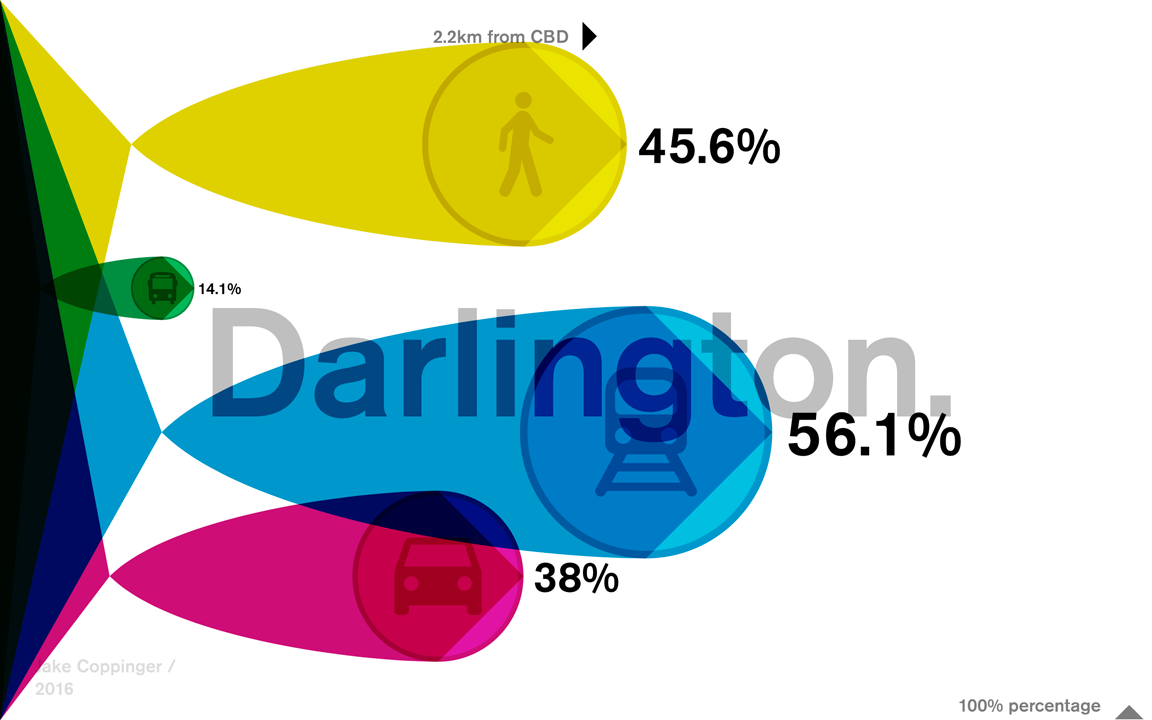
This visualisation looks at the City of Sydney "Transport to work in Sydney" dataset over 2011, over all Sydney suburbs and across walking, buses, trains and car modes of transit. Each colour represents a different mode.
The horizontal position of the mouse controls the distance between the CBD and the outer most suburb. As the mouse is moved, the suburbs that is visualised will change. As there are a finite number of suburbs and a continuous distance value, the data is interpolated smoothly between suburbs. The opacity of the suburb title text transitions smoothly as the distance changes from the position of one suburb to another.
The vertical position of the mouse position will transition between visualising relative (percentage) and absolute data. When the mouse is at the bottom of the screen the percentage mode percentage is show, while at the top of the screen the absolute number of people using each mode is shown. The size of the geometric shapes animates to match.
-
Install NodeJS and NPM Check they are installed using
node --versionandnpm --version -
Clone with Git using
git clone https://github.com/jakecoppinger/transit-in-sydney.git -
Change into directory
cd transit-in-sydney -
Install NPM dependencies with
npm install(this may take a while)
To serve using Browsersync (with live reload and JavaScript linting) gulp serve
gulp build
You can serve up the built files using: cd dist/ && python -m SimpleHTTPServer
Access this at http://localhost:8000
- One-time (on load) processing of JSON data to the formats required by the visualisation in
source/js/data_processing.js(model)
- Shape drawing in
source/js/draw_geometric_shapes.js(view) - Text drawing in
source/js/draw_text_and_labels(view)
- Main p5js (Processing) setup() and draw() in
source/js/main.js(controller) - Conbination of various JavaScript files into the singular p5 object in
source/js/createP5.js
- JavaScript extensions to p5.js in
source/js/p5js_extensions.jsandpoint.js
- Original data from the City of Sydney "Transport to work in Sydney" dataset in
data_preprocessing/City of Sydney Transport to Work dataset.csv - CSV data for suburb distance from CBD (measured with Google Maps distance tool at
data_preprocessing/suburb_distances.csv - Python data preprocessing script at
data_preprocessing/generateJson.py - Final JSON for use in visualisation generated into
source/data/city_of_sydney_transport_data_2011.json
Jake Coppinger, a first year Computer Science student based in Sydney, Australia.
See more of my work at jakecoppinger.com