26th place entry (out of 4540) for Kaggle LANL Earthquake Prediction competition
The goal of this competition was to predict the timing of a laboratory earthquake based on acoustic time series data. The acoustic_data input signal is used to predict the time remaining before the next laboratory earthquake (time_to_failure).
More info can be found at the Kaggle site: https://www.kaggle.com/c/LANL-Earthquake-Prediction/overview
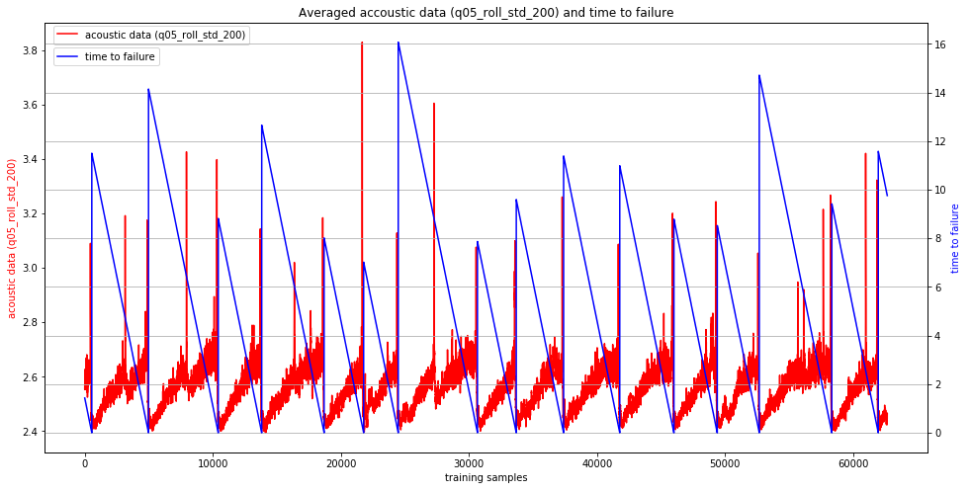
The time series data shows 16 experiments, with 14 of them complete. There are approximately 600,000,000 acoustic time samples in the data. Each time sample also has the time remaining before the next earthquake occurs. The 'timetofailure' data is retrospective -not causal. At the time point the experiment is started, no one knows the timetofailure, since it has not yet physically failed in the run. That is what makes this prediction problem hard.
The test data reflects many small (150,000 time sample) segments. For each the model is required to predict a single time to failure.
Only training data reflecting the 14 completed experiments were used in the training to help ensure the training data distribution reflects full experiments. Training data was segmented into 150,000 sample batches in order to match the test conditions. Batches were taken out of each of the 14 experiments. Batches were selected so that experiments were not mixed within a batch. Batches were allowed to overlap within a particular experiment, using a step of 30,000 for a batch size of 150,000.
Feature Generation was inspired by this starter kernel: https://www.kaggle.com/artgor/earthquakes-fe-more-features-and-samples The following additional features were added into the mix for final selection:
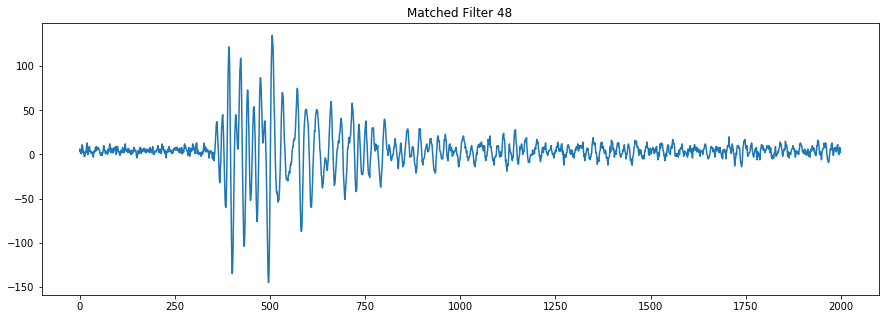
A matched filtering approach was used to generate some additional features. Matched filtering is a way to identify patterns in a time series and is used in radar, sonar, well as earthquake analysis. I reviewed the acoustic data in Audacity and identified what looked like common and repeated patterns both early and late in the experiments. These short samples (1000-3000 time stamps) were used to build a set of matched filter detectors using cross correlation between the sample and the training data set.
The hilbert transform was used to derive the analytical envelope of the matched filter outputs as well as the unfiltered training data. For the unflitered training data the hilbert transform was low-pass filtered and the 10th percentile value was used (over the 150,000 time samples) in order to reflect the amount of peaks.
A short term fourier transform was applied to both the match filtered and raw training data at various frequency bands. The bands were selected based on bands with most signal energy during exploratory FFT analysis of the whole training data set.
Peak detection was used on both the matched filter features as well as STFT features.
As a result of all the combinations of the above approaches 451 features were generated.
Features were ranked in order of absolute correlation (ignoring features where correlation had no statistical significance)
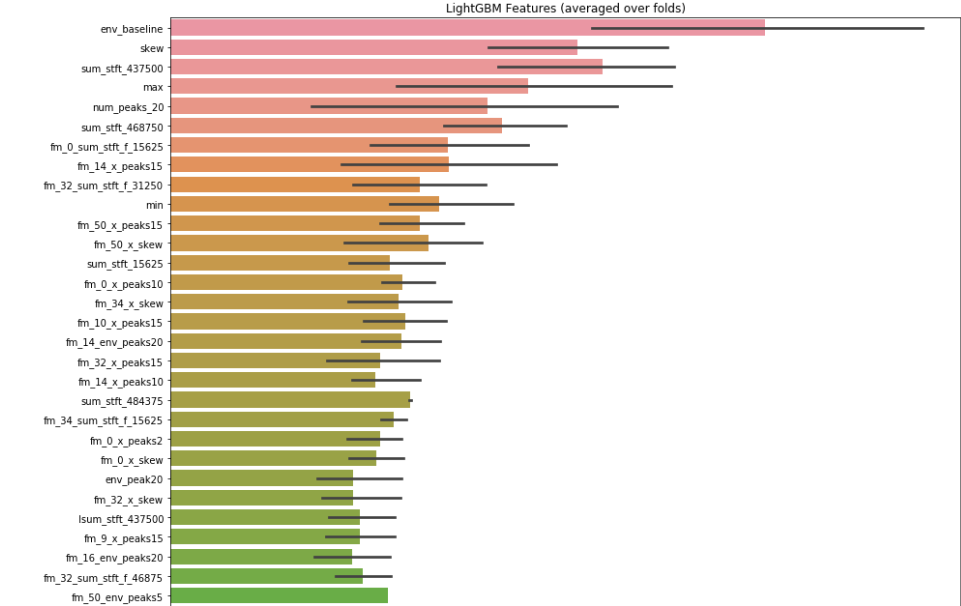
Features were selected using the feature importances given by the LGBM model. 5- fold cross-validation was used, grouping experiments within the folds. This resulted in an ordered list of features.
The following commbinations were made, resulting in 384 models n_fold of 5, 14, 20. For n_fold of 14, experiments were not split between folds. number of features of 10, 15, 20, 30, 50, 60, 70, all features sordered via correlation, or via model number of leaves of 31, 51, 91, 121 boost type of gbdt or random forest
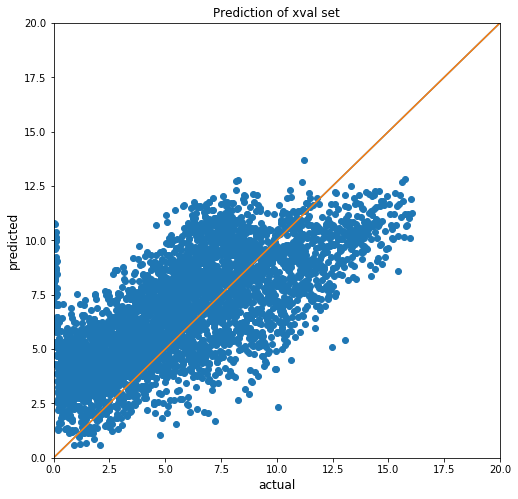
Model selection was based on the best cross-validation scores. The contest allowed two submissions to be considered. These were selected so one was a result of cross-validation which does not group experiments, and one where experiment grouping was allowed.
Full notebook (via nbviewer): https://nbviewer.jupyter.org/github/filipmu/Kaggle-LANL-Earthquake-Prediction/blob/master/Kaggle%20LANL%20Earthquake%20Prediction%2013-best%20scoring%20submission.ipynb