The Verde tutorial at Transform 2020 💚
Instructors: Leonardo Uieda1 and Santiago Soler2,3
1University of Liverpool, UK | 2CONICET, Argentina | 3Universidad Nacional de San Juan, Argentina
| Info | |
|---|---|
| When | Thursday, June 11 • 08:00 - 11:00 GMT |
| Slack (Q&A) | Software Underground channel t20-thu-verde |
| Live stream | https://youtu.be/-xZdNdvzm3E |
| conda environment | t20-thu-verde |
| Verde documentation | https://www.fatiando.org/verde |
Make sure you've done these things before the tutorial on Thursday:
- Sign-up for the Software Underground Slack
- Join the channel
t20-thu-verde. This is where all communication will happend. - Set up your computer (intructions below). We will not have time to
solve many computer issues during the tutorial so make sure you do this
ahead of time. If you need any help, ask at the
t20-thu-verdechannel on Slack. - If you have some data you'd like to process, please have it ready and make sure you can load it with pandas or numpy. You'll have some time at the end of the tutorial to work on your own data.
This tutorial will be a hands-on tour of Verde, a Python package for processing and gridding geophysical/geospatial data with a twist of machine learning. We'll start with a real dataset and work our way towards producing one or more gridded products. The way there will take us through:
- Loading some data
- Generating and handling coordinates and projections (using pyproj)
- Splitting training and testing data for validation
- Data decimation with blocked means/medians to avoid aliasing
- 2D trend estimation
- Gridding with bi-harmonic splines
- Combining everything into a data processing pipeline
- Cross-validation of data distributed spatially on the Earth (including parallel execution with Dask)
- Some knowledge of Python is assumed (for example, you might want to attend this or this tutorial).
- All coding will be done in Jupyter notebooks. I'll explain how they work briefly but it will help if you've used them before.
- We'll use numpy, pandas, xarray, and matplotlib. You don't need to be an expert in these tools but some familiarity will help.
There are a few things you'll need to follow the tutorial:
- A working Python intallation (Anaconda or Miniconda)
- The Verde tutorial conda environment installed
- A web browser that works with JupyterLab (basically anything except Internt Explorer)
To get things setup, please do the following.
If you have any trouble, please ask for help in the
t20-thu-verde channel on the Software Underground slack.
Windows users: When you see "terminal" in the instructions, this means the "Anaconda Prompt" program for you.
Follow the general instructions for Transform2020: http://swu.ng/t20-python-setup (there are also YouTube videos of Windows and Linux)
This will get you a working Python 3 installation with the conda package
manager. If you already have one, you can skip this step.
Create the t20-thu-verde conda environment:
- Download the
environment.ymlfile from here (right-click and select "Save page as" or similar) - Make sure that the file is called
environment.yml. Windows sometimes adds a.txtto the end, which you should remove. - Open a terminal. The following steps should be done in the terminal.
- Navigate to the folder that has the downloaded environment file (if you don't know how to do this, take a moment to read the Software Carpentry lesson on the Unix shell).
- Create the conda environment by running
conda env create --file environment.yml(this will download and install all of the packages used in the tutorial).
Verify that the installation works:
- Download the
test_install.pyscript from here - Open a terminal. The following steps should be done in the terminal.
- Activate the environment:
conda activate t20-thu-verde - Navigate to the folder where you downloaded
test_install.py - Run the test script:
python test_install.py - You should see this text in the terminal (the last part of the second line will depend
on your system):
Verde version: v1.5.0 Downloading file 'baja-bathymetry.csv.xz' from 'https://github.com/fatiando/verde/raw/v1.5.0/data/baja-bathymetry.csv.xz' to '/home/USER/.cache/verde/v1.5.0'. - The following figure should pop up:
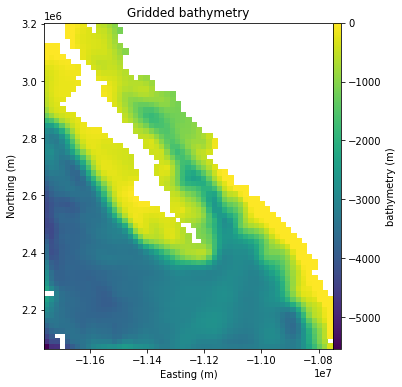
If none of these commands gives an error, then your installation should be working.
If you get any errors or the outputs look significantly different,
please let us know on Slack at #t20-thu-verde.
Start Jupyter notebook:
- Windows users: Make sure you set a default browser that is not Internet Explorer.
- Activate the conda environment:
conda activate t20-thu-verde - Start the Jupyter notebook server:
jupyter notebook - Jupyter should open in your default web browser. We'll start from here in the tutorial and create a new notebook together.
If you really can't get things to work on your computer, you can run the code online through Google Colab (you will need a Google account). A starter notebook that installs Verde can be found here: https://swu.ng/ea31AO
To save a copy of the Colab notebook to your own account, click on the "Open in playground mode" and then "Save to Drive". You might be interested in this tutorial for an overview of Google Colab.
Due to the number of participants, we can't do anything too interactive. Instead, we'll do a brief introduction, some live coding using an example dataset with a couple of exercises in the middle, and finally you'll have time to work on your own data (or another example dataset).
| Time | Activity |
|---|---|
| 8:00 - 8:20 | Introduction |
| 8:20 - 9:00 | Loading data, projections, slicing, blocked reductions, trends |
| 9:00 - 9:20 | Break |
| 9:20 - 10:00 | Train-test-split, gridding, cross-validation, hyper-parameter optimizationa |
| 10:00 - 10:10 | Wrap-up: state of the project, future directions, how to get involved |
| 10:10 - 11:00 | Q&A on Slack, work on your own data, informal chat |
We'll use some public domain
datasets in the tutorial. The datasets are trackline bathymetry measurements
from the NOAA NCEI.
The data files in MGD77T format
are stored in the data folder of this repository.
| File | Location | Download | MD5 hash |
|---|---|---|---|
ew9105.m77t |
Wilkes Fracture Zone in the South Pacific | https://raw.githubusercontent.com/fatiando/transform2020/master/data/ew9105.m77t | md5:27a0f501251b9dd5a1413722e1c406ea |
cd8794.m77t |
Reykjanes Ridge near Iceland | https://raw.githubusercontent.com/fatiando/transform2020/master/data/cd8794.m77t | md5:48be7f63d020dacdb95116d88e35fc61 |
b00297.m77t |
Loihi Seamount in Hawai'i | https://raw.githubusercontent.com/fatiando/transform2020/master/data/b00297.m77t | md5:8a6eaadbd732b54f65075c9e18593f82 |
All code and text in this repository is free software: you can redistribute it and/or modify it under the terms of the BSD 3-clause License. A copy of this license is provided in LICENSE.