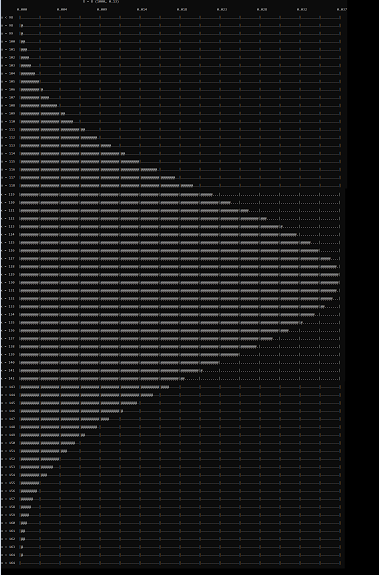
An ASCII visualizer for the probability mass function of a binomial distribution.
					 X ~ B (10, 0.5)

	0.000     0.032     0.065     0.098     0.131     0.164     0.196     0.229

x < 1	 |....|....|....|....|....|....|....|....|....|....|....|....|....|....|....|

x = 1	 |@@..|....|....|....|....|....|....|....|....|....|....|....|....|....|....|

x = 2	 |@@@@|@@@@|@@@.|....|....|....|....|....|....|....|....|....|....|....|....|

x = 3	 |@@@@|@@@@|@@@@|@@@@|@@@@|@@@@|@@@@|....|....|....|....|....|....|....|....|

x = 4	 |@@@@|@@@@|@@@@|@@@@|@@@@|@@@@|@@@@|@@@@|@@@@|@@@@|@@@@|@@@@|@@..|....|....|

x = 5	 |@@@@|@@@@|@@@@|@@@@|@@@@|@@@@|@@@@|@@@@|@@@@|@@@@|@@@@|@@@@|@@@@|@@@@|@@@@|

x = 6	 |@@@@|@@@@|@@@@|@@@@|@@@@|@@@@|@@@@|@@@@|@@@@|@@@@|@@@@|@@@@|@@..|....|....|

x = 7	 |@@@@|@@@@|@@@@|@@@@|@@@@|@@@@|@@@@|....|....|....|....|....|....|....|....|

x = 8	 |@@@@|@@@@|@@@.|....|....|....|....|....|....|....|....|....|....|....|....|

x = 9	 |@@..|....|....|....|....|....|....|....|....|....|....|....|....|....|....|

x > 9	 |....|....|....|....|....|....|....|....|....|....|....|....|....|....|....|


Mean = 5
Mode = 5
Variance = 2.5

x	 P(X=x)
0	0.000977
1	0.009766
2	0.043945
3	0.117188
4	0.205078
5	0.246094
6	0.205078
7	0.117188
8	0.043945
9	0.009766
10	0.000977
When n = 1000 and p = 0.13:
All the code required to run the program in main.cpp. It is recommended to put your terminal in full screen. If you are using an online compiler use the code from OnlineCompilerVersion file.
Call function as :
BinomialVisualiser(n, p);For large values of
Several parameters of the diagram can tweaked but is not recommended to do so because of different possible sizes of the terminal.
The default settings should work on all terminals which are in full screen:
TotalBlocks = 10; //controls grid width
Subdivisions = 8; //controls grid width
NumberOfDP = 3; //controls the number of decimal places for numbers on scaleIncreasing TotalBlocks and Subdivisions will increase the accuracy of the plotting but also increases the size of the diagram horizontally.
As a rule of thumb to avoid invalid diagrams, try to satisfy the following conditions :
TotalBlocks * Subdivisions < 100(so that there is no "merging" of rows)TotalBlocks > 5Subdivisions > 0
NumberOfDP determines the number of decimal places in the numbers displayed on the scale.
Condition that must always be satisfied : Subdivisions > NumberOfDP