ImageJ/FIJI plugin reading PicoQuant ptu/pt3 FLIM TTTR image files.
It is based/upgraded from Pt3Reader plugin developed by François Waharte and Matlab code from PicoQuant.
- You need to download and install ImageJ or FIJI on your computer first.
- Download PTU_Reader_...jar and place it in the "plugins" folder of ImageJ/FIJI.
- Plugin will appear as PTU_Reader in ImageJ's Plugins menu.
- Click PTU_Reader line in ImageJ's Plugins menu.
- In "Open File" dialog choose file with (ptu/pt3) extension to load.
- Plugin will read file's header and provide you with following options:
- Choose what images/stacks you want to load (see detailed description below) and click OK.
This is 8-bit stack containing 4096 frames (since v.0.0.7 it will be trimmed to max observed value). Each frame corresponds to a lifetime value. Why 4096? It is number of time registers in PicoQuant module. To get real time value in nanoseconds (ns), you need to know frequency of laser pulses during acquisition. Suppose laser frequency is 40MHz. That means distance between pulses is 1/40x10^6 = 25 ns. That means this period is splitted by 4096 intervals, i.e. time difference between frames = 25/4096 ~ 6.1 picoseconds (ps, 10^-12).
NB: Since v.0.0.7 stack will be trimmed to max observed value, i.e. 3210 or something else, to save a bit of memory.
The intensity of pixel at x,y position corresponds to the number of photons with this lifetime during the whole acquisition.
Don't forget to do Image->Adjust->Brightness/Contrast to see the signal.
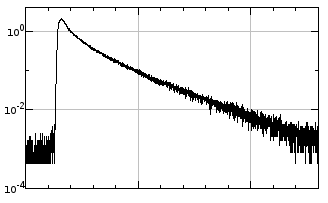
For example, to get a FLIM decay curve of some image area that would look like this:
select rectangular ROI and go to Image->Stacks->Plot Z-axis profile. You can make plot y-axis logarithmic by clicking More>>Set Range..
In addition, there are two loading options: "Load whole stack" and "Load binned". First option assembles all photons in one stack with 4096 frames (lifetimes). "Load binned" creates Hyperstack where z coordinate corresponds to 4096-format lifetime, while "time" corresponds to binned frame intervals specified by "Bin size in frames" parameter below. Last option can generate HUGE files (since imagewidth x imageheight x 4096 x binned frames), so be aware about it.
If you choose "Load only frame range" option at the bottom of the dialog, it will also restrict detected photons to the specified range.
Lifetime acquisition often happens over multiple frames. If this option is checked in the menu, plugin will provide intensity stack for each frame (if binning is 1) or summarized intensity of multiple frames for the bin size larger than 1.
In addition, for the same number of binned frames, it will generate average lifetime value map.
Important: the lifetime value is in the same 4096 register format! Use the same math/laser frequency recalculation to get value in nanoseconds. Whole image/stack math can be done using ImageJ Process->Math options.
So you can observe average lifetime change during acquisition. It is recommended to you different LUT to highlight its changes (Image->Lookup Tables->Spectrum or Rainbow RGB)
These two stacks are in 32-bit format.
You can restrict the interval of loaded data by selecting "Load only frame range" checkbox and providing the range of frames to load.
Send me example of your file by email, describe the problem and I'll try to incorporate it to the plugin.
v.0.0.9 (2020.11) Thanks to Robert Hauschild feedback, corrected PT3 file format reading issues (actually it was diabled before). Added version number to the plugin menu, next to its name.
v.0.0.8 (2020.09) Thanks to Emma Wilson feedback, corrected some HydraHarp/TimeHarp260 T3 file format issues. Corrected channel names in the exported stack.
v.0.0.7 (2019.02) Thanks to Marco Dalla Vecchia feedback, now HydraHarp/TimeHarp260 T3 file format is supported. Plus plugin works correctly with multi-channel FLIM data. The error of dtime=0 is fixed. Added progress bar for initial data assessment.
v.0.0.6 (2018.03) Thanks to Tanja Kaufmann feedback, data reading is updated. Now there are two modes of reading, depending if the Frame marker is present. Plus LineStart and LineStop marker values are read from the header. + WRAPAROUND value is changed to 65536.
v.0.0.5 (2017.05) Thanks to Shunsuke Takeda feedback, the error of "missing first frame" is eliminated.
v.0.0.4 (2017.04) Thanks to Bruno Scocozza feedback, frame marker bug during loading is fixed now. Plus, "frame range" and lifetime binning options are added.
v.0.0.2 (2017.03) file dialog changed to system default (now works on Mac, no need in java library).
Developed in Cell Biology group of Utrecht University.
Email katpyxa @ gmail.com for any questions/comments/suggestions.


