This is a project undertaken at the Theoretical Ecology & Evolution Lab in the Center for Ecological Sciences, Indian Institute of Science, for the identification of algal colonies in images of coral reefs.
-
This project aims to develop a tool to identify different algal species in the in a given coral reef image.
-
Currently, the tool is written in Python, incorporating the following libraries:
- OpenCV - For analyzing, reading, writing of the image.
- Pandas - For building image 'data frames' for ease of data manipulation.
- Numpy - For building custom arrays throughout the program.
Note: Code is still in it's nascent stages and has not been developed completely. Feel free to reach out if you would like to collaborate or have ideas to fix discrepancies.
-
A
parser()function is used to read input parameters from the user. The parameters used right now are--file_nameand--color_mode.--file_nameis used to locate the image which has to be analyzed.--color_modeis used to specify the type of algal colony to be classified in the given sample.
Note: Currently, the
--color_modeparameter is not being used, and by default only red algae are being identified. -
The
file_nameargument is then passed onto theimage_reader()which accepts the arguments from theparser()and extracts the image from the disc. -
The image is then viewed for the convenience of the user using the
image_viewer()function. -
The image is then passed onto the
pre_processing()functions, which performs the following functions as mentioned:cv2.resize()which is used to resize the image, making it faster to carry out computations. The image is scaled to a quarter of the origin image size, along both the axes.cv2.GaussianBlur()which is used to apply a Gaussian Blur on the image, thereby reducing the noise levels associated with it.
-
The pandas
dataframeis built next. The dimensions are equivalent to the dimensions of the image. Python passing arguments by reference. Hence, manipulation of the elements of thedataframebrings about changes in the channel values of the images. -
The pixel information of the image is then transferred into the pandas
dataframeusing thepixel_extractor()function, where different operations can be run on it to modify pixel values. -
We then apply the
max_channel_value()function, to cycle through each of the pixel and then express only the channel which possess the maximum value in comparison to the rest of channels belonging to that pixel. -
To start out, we detect the presence of red algae in the images provided, hence filter the pixels which contain only the red channel as the maximum channel value. This is done using the
red_value_determiner(). -
In order to threshold and run analysis (such as regression), we transfer the pixels onto another pandas
dataframeusing thered_value_extractor()function.
-
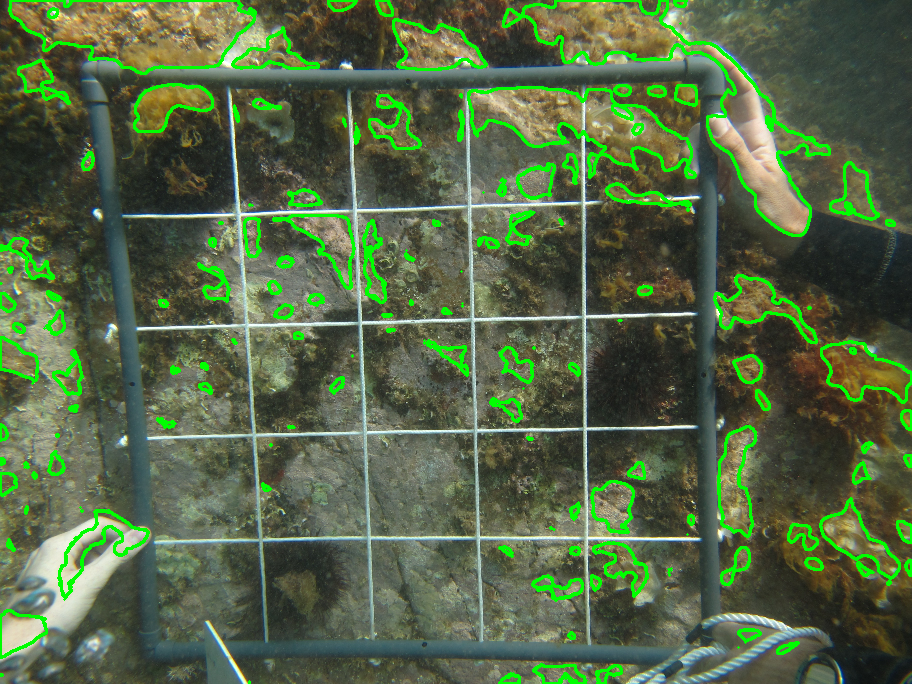
Sample_Image_1
Fig 1.1 Original Sample_Image_1, post resizing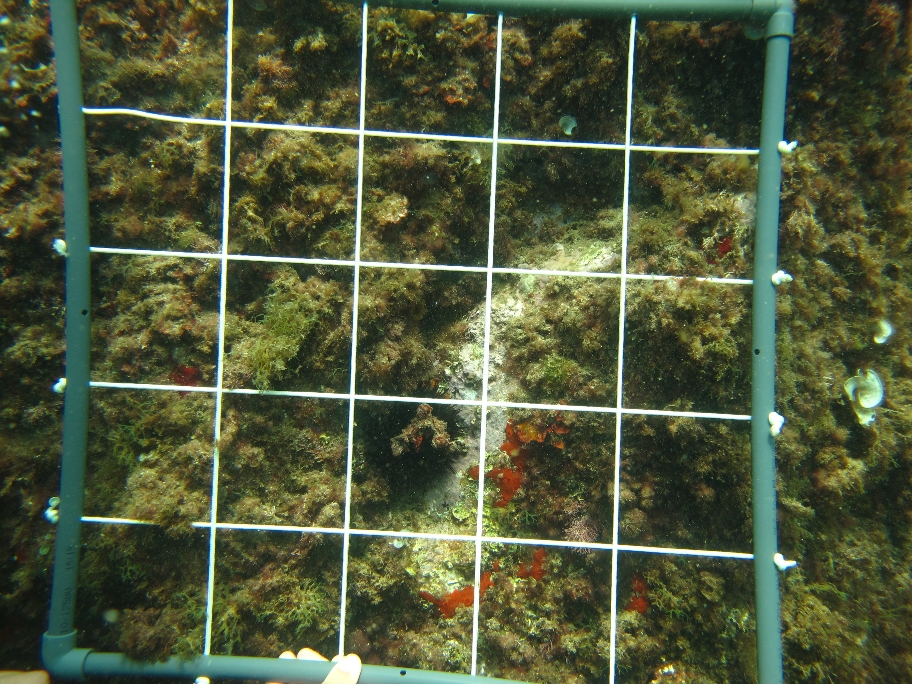
Fig 1.2 Contoured Sample_Image_1, post resizing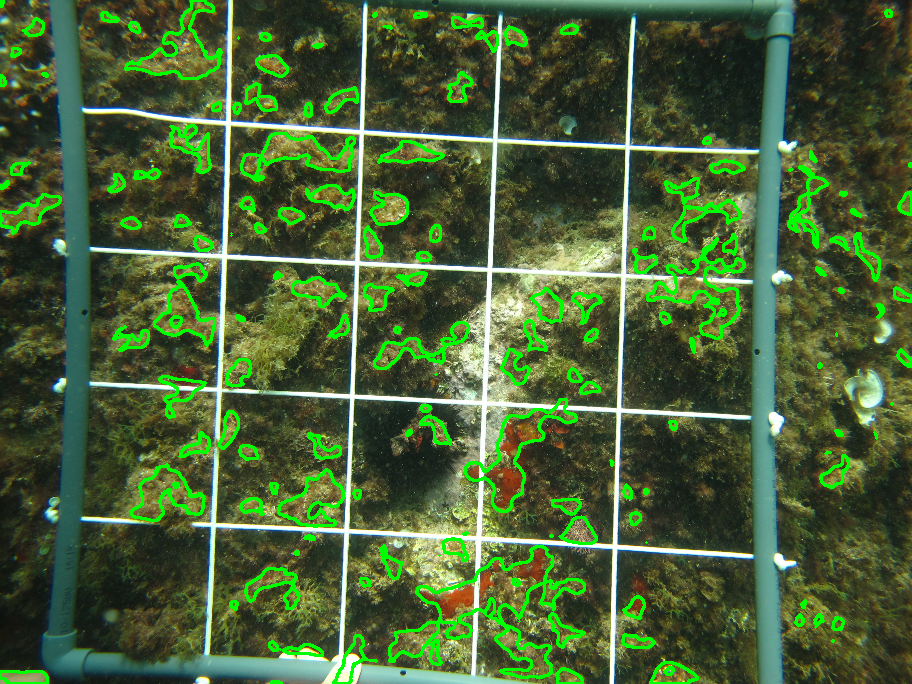
-
Sample_Image_2
Fig 2.1 Original Sample_Image_2, post resizing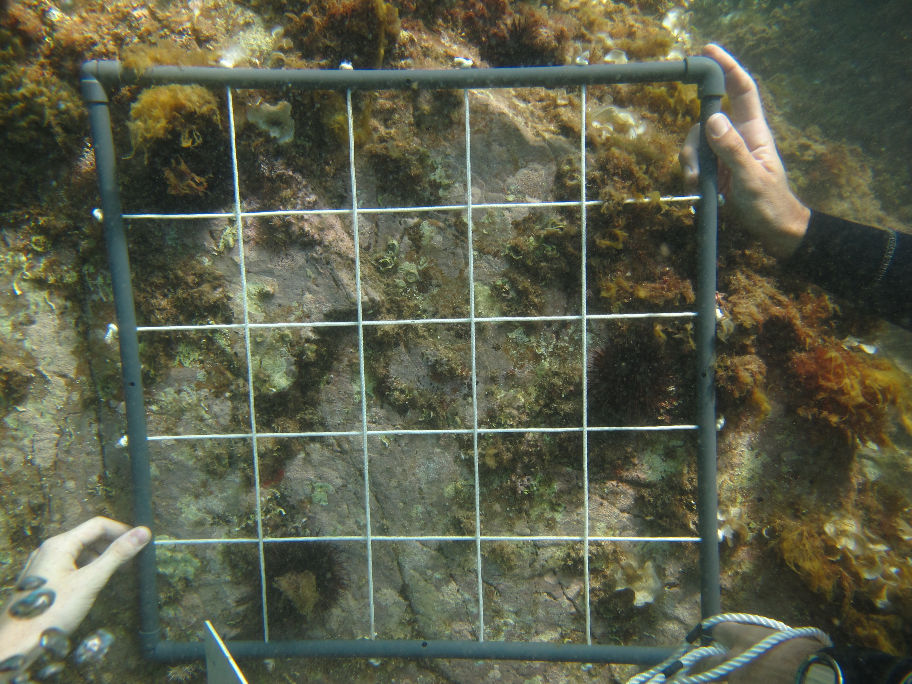
Fig 2.2 Contoured Sample_Image_2, post resizing