A simple Graphviz binding for Typst using the WebAssembly plugin system.
This plugin is quite simple to use, you just need to import it:
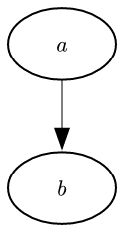
#import "@preview/diagraph:0.2.4": *You can render a Graphviz Dot string to a SVG image using the render function:
#render("digraph { a -> b }")Alternatively, you can use raw-render to pass a raw instead of a string:
#raw-render(
  ```dot
  digraph {
    a -> b
  }
  ```
)
For more information about the Graphviz Dot language, you can check the official documentation.
render and raw-render accept multiple arguments that help you customize your graphs.
-
engine(str) is the name of the engine to generate the graph with. Available engines are circo, dot, fdp, neato, nop, nop1, nop2, osage, patchwork, sfdp, and twopi. Defaults to"dot". -
widthandheight(lengthorauto) are the dimensions of the image to display. If set toauto(the default), will be the dimensions of the generated SVG. If alength, cannot be expressed inem. -
clip(bool) determines whether to hide parts of the graph that extend beyond its frame. Defaults totrue. -
background(noneorcolororgradient) describes how to fill the background. If set tonone(the default), the background will be transparent. -
labels(dict) is a list of labels to use to override the defaults labels. This is discussed in depth in the next section. Defaults to(:). -
xlabels(dict) is a list of labels to use to override the defaults xlabels. This is discussed in depth in the next section. Defaults to(:). -
clusters(dict) is a list of clusters to use to override the defaults clusters labels. This is discussed in depth in the next section. Defaults to(:).
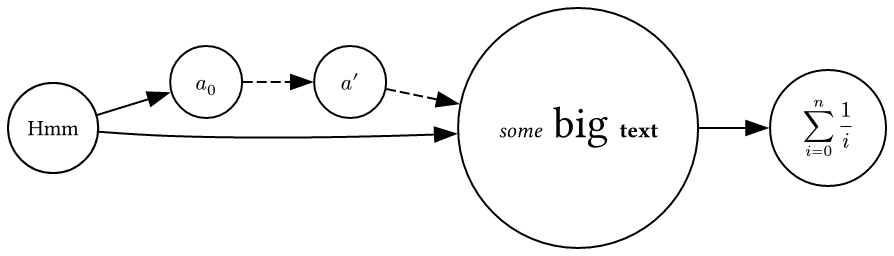
By default, all node labels are rendered by Typst. If a node has no explicitly set label (using the [label="..."] syntax), its name is used as its label, and interpreted as math if possible. This means a node named n_0 will render as 𝑛0.
If you want a node label to contain a more complex mathematical equation, or more complex markup, you can use the labels argument: pass a dictionary that maps node names to Typst content. Each node with a name within the dictionary will have its label overridden by the corresponding content.
#raw-render(
  ```
  digraph {
    rankdir=LR
    node[shape=circle]
    Hmm -> a_0
    Hmm -> big
    a_0 -> "a'" -> big [style="dashed"]
    big -> sum
  }
  ```,
  labels: (:
    big: [_some_#text(2em)[ big ]*text*],
    sum: $ sum_(i=0)^n 1/i $,
  ),
)
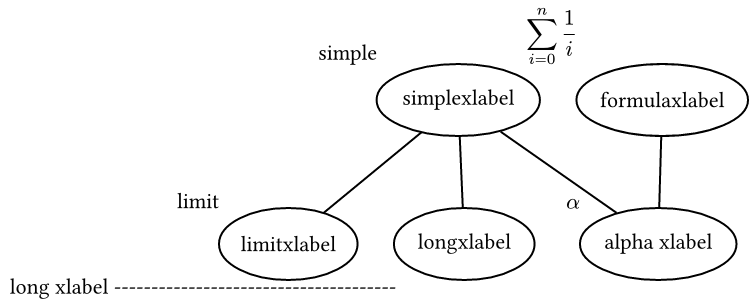
Like labels, all xlabels are rendered by Typst. If you want a xlabel to contain a more complex mathematical equation, or more complex markup, you can use the xlabels argument: pass a dictionary that maps edge names to Typst content. Each node with a name within the dictionary will have its xlabel overridden by the corresponding content.
#raw-render(```
  graph {
    simplexlabel[xlabel="simple"]
    simplexlabel -- limitxlabel
    simplexlabel -- longxlabel
    longxlabel[xlabel="long xlabel --------------------------------------"]
    "alpha xlabel"[xlabel="alpha"]
    simplexlabel -- "alpha xlabel"
    limitxlabel[xlabel="limit"]
    formulaxlabel -- "alpha xlabel"
  }
  ```,
  xlabels: (
    formulaxlabel: $ sum_(i=0)^n 1/i $
  )
)
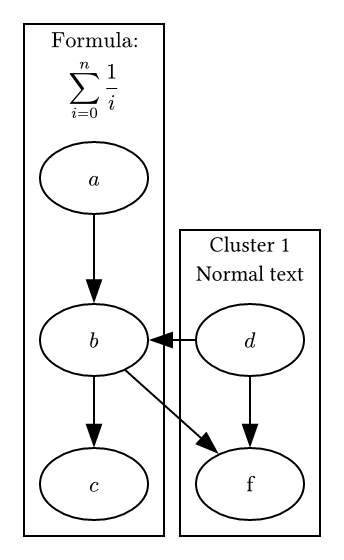
Clusters are a way to group nodes together in graphviz. Clusters labels are rendered by Typst. If you want a cluster label to contain a more complex mathematical equation, or more complex markup, you can use the clusters argument: pass a dictionary that maps cluster names to Typst content. Each cluster with a name within the dictionary will have its label overridden by the corresponding content.
#raw-render(```
  digraph {
    subgraph cluster_0 {
      a -> b -> c
    }
    subgraph cluster_1 {
      label="Cluster 1\nNormal text"
      d->b
      b->f
      d->f
    }
  }
  ```,
  clusters: (
    cluster_0: $ "Formula:"\ sum_(i=0)^n 1/i $
  )
)
This project was built with emscripten 3.1.46. Apart from that, you just need to run make wasm to build the wasm file. All libraries are downloaded and built automatically to get the right version that works.
There are also some other make commands:
make link: Link the project to the typst plugin foldermake clean: Clean the build folder and the linkmake clean-link: Only clean the linkmake compile_database: Generate the compile_commands.json filemake module: It copy the files needed to run the plugin in a folder calledgraphvizin the current directorymake wasi-stub: Build the wasi stub executable, it require a rust toolchain properly configured
Somme functions need to be stubbed to work with the webassembly plugin system. The wasi-stub executable is a spetial one fitting the needs of the typst plugin system. You can find the source code here. It is important to use this one as the default subbed functions are not the same and the makefile is suited for this one.
This package also uses a protocol generator to generate the wasm interface. You can find the source code here. It is a required dependency to build this project.
This project is licensed under the MIT License - see the LICENSE file for details
- Added support for xlabels which are now rendered by Typst
- Added support for cluster labels which are now rendered by Typst
- Fix a margin problem with the clusters
- Updated to typst 0.11.0
- Added support for
fontcolor,fontsizeandfontnamenodes attributes - Diagraph now uses a protocol generator to generate the wasm interface
- Fix an alignment issue
- Added a better mathematic formula recognition for node labels
- Added support for relative lenghts in the
widthandheightarguments - Fix various bugs
- Node labels are now handled by Typst
- Graphs are now scaled to make the graph text size match the document text size
- Remove the
raw-render-ruleshow rule because it doesn't allow use of custom font and therender/raw-renderfunctions are more flexible - Add the
backgroundparameter to therenderandraw-rendertypst functions and default it totransparentinstead ofwhite - Add center attribute to draw graph in the center of the svg in the
renderc function
Initial working version