![]()
Fulu is a python library of methods for astronomical light curves approximation based on machine learning. It was named after the variable star Zeta Cassiopeiae 590 light-years from the Sun and officially named Fulu.
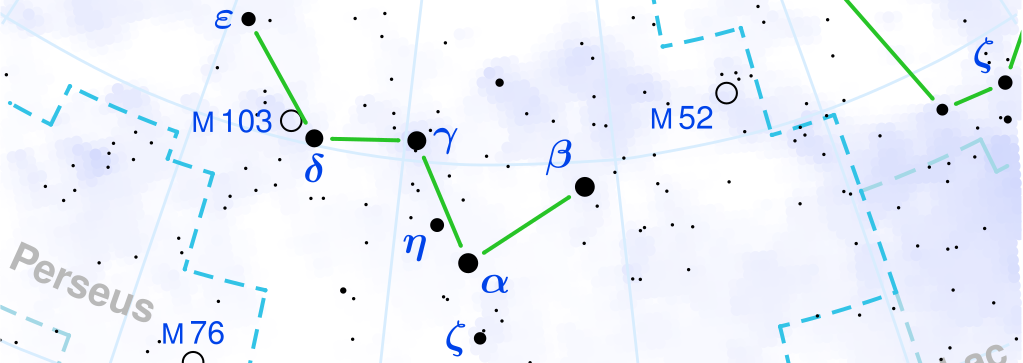 Cassiopeia constellation [source]
![[source]](https://en.wikipedia.org/wiki/File:Cassiopeia_constellation_map.svg)
The library contains our implementation of light curve approximation method based on Gaussian Processes described in [1], and several other methods based on Normalizing Flows, Shallow and Bayesian Neural Networks considered in [2, 3].
- [1] K. Boone. “Avocado: Photometric Classification of Astronomical Transients with Gaussian Process Augmentation.” The Astronomical Journal (2019). [journal][arxiv]
- [2] M. Demianenko, E. Samorodova, M. Sysak, A. Shiriaev, K. Malanchev, D. Derkach, M. Hushchyn. "Supernova Light Curves Approximation based on Neural Network Models." Journal of Physics: Conference Series (2023). [journal][arxiv]
- [3] M. Demianenko, K. Malanchev, E. Samorodova, M. Sysak, A. Shiriaev, D. Derkach, M. Hushchyn. “Understanding of the properties of neural network approaches for transient light curve approximations.", Astronomy & Astrophysics (2023). [journal][arxiv]
If you use Fulu in a scientific publication, we would appreciate citations to the following paper:
- M. Demianenko, K. Malanchev, E. Samorodova, M. Sysak, A. Shiriaev, D. Derkach, M. Hushchyn. Understanding of the properties of neural network approaches for transient light curve approximations.", Astronomy & Astrophysics (2023). [journal][arxiv]
pip install fuluor
python3 -m pip install git+https://github.com/HSE-LAMBDA/fuluimport numpy as np
import fulu
# generate a light curve
passband2lam = {'u': np.log10(3751.36), 'g': np.log10(4741.64), 'r': np.log10(6173.23)}
n_per_band = 10
n = n_per_band * len(passband2lam)
t = np.linspace(0.0, n-1, n)
flux = 10.0 + np.sin(2*t) + np.random.normal(0, 0.1, len(t))
flux_err = 0.1 * np.ones_like(flux)
passbands = np.tile(list(passband2lam), n_per_band)
# approximation
aug = fulu.GaussianProcessesAugmentation(passband2lam)
aug.fit(t, flux, flux_err, passbands)
# augmentation
t_aug, flux_aug, flux_err_aug, passband_aug = aug.augmentation(t.min(), t.max(), 100)
# visualization
plotic = fulu.LcPlotter(passband2lam)
plotic.plot_one_graph_all(t=t, flux=flux, flux_err=flux_err, passbands=passbands,
t_approx=t_aug, flux_approx=flux_aug,
flux_err_approx=flux_err_aug, passband_approx=passband_aug)
Please find a plotting example in notebooks_examples/plotting.ipynb