Skip to content
New issue

Have a question about this project? Sign up for a free GitHub account to open an issue and contact its maintainers and the community.

By clicking “Sign up for GitHub”, you agree to our terms of service and privacy statement. We’ll occasionally send you account related emails.

Already on GitHub? Sign in to your account

Line voronoi diagram and network voronoi diagram features #292

Open
ResidentMario opened this issue Jul 5, 2019 · 16 comments
Open

Line voronoi diagram and network voronoi diagram features #292

ResidentMario opened this issue Jul 5, 2019 · 16 comments

Comments

@ResidentMario
Copy link

By way of background, this feature request was spawned by work I am doing on analyzing a dataset of trash pickup locations in San Francisco. The fundamental problem with this dataset is that GPS coordinates are inaccurate, so the point data needs to be snapped to nearby linear features (streets, blockfaces) and polygonal features (buildings, blocks) for analysis. I started a discussion in the PySAL Gitter regarding the best way to approach a specific problem in this projection:

I wanted to assign each slice of street to a nearby building (within a certain tolerance), the idea being that this would allow me to map trash > street point > building, and say stuff like "cigarettes are 200% more likely to show up in front of a liquor store!". I was wondering if there was anything in the PySAL gamut that could help with this operation.

@jGaboardi helpfully replied with the following comment:

[...] please open an issue in spaghetti with this information and we can continue the discussion there.

My initial thoughts are that you may try:

  • A line voronoi diagram derived from street segments as generators. When a building intersects a LVD cell it is assigned to the generator street. Or,
  • A network voronoi diagram derived from building points (snapped to the network) as generators. All locations within a NVD cell (along the network partition) are assigned to its generator building.

[...]

Becasue there was no “easy access” LVD generator in python I build my own method for doing it which I am implementing in my dissertation. Happy share the method and details via libpysal/spaghetti once I get my dissertation finished.

This issue is that feature request for the following additional types of Voronoi diagram generation and point-snapping algorithms (in addition to the existing):

  • Line voronoi diagrams
  • Network voronoi diagrams.
@ResidentMario
Copy link
Author

(apologies that this take so long to log to GitHub)

@jGaboardi
Copy link
Member

@ResidentMario Thanks for logging this. Hopefully this will be something I can get started on in the next several months. It will be super exciting to have this functionality included in libpysal/spaghetti. In the meantime, if you have any ideas or contributions feel free to start a PR or post more thoughts in here.

@ljwolf @sjsrey @weikang9009 @knaaptime @renanxcortes @slumnitz
In terms of network allocation methods, would having something like Line Voronoi Diagram generation make more sense in libpysal.cg or directly in spaghetti? My thought is probably in libpysal.cg. However, once I am graduated I want to also add the method for allocating populations to networks I propose in my dissertation. Whether this makes more sense in its own package or as part of spaghetti is something I would like to discuss/get other's opinions on. Any input is welcome.

@renanxcortes
Copy link

renanxcortes commented Jul 6, 2019

@ResidentMario Thanks for logging this. Hopefully this will be something I can get started on in the next several months. It will be super exciting to have this functionality included in libpysal/spaghetti. In the meantime, if you have any ideas or contributions feel free to start a PR or post more thoughts in here.

@ljwolf @sjsrey @weikang9009 @knaaptime @renanxcortes @slumnitz
In terms of network allocation methods, would having something like Line Voronoi Diagram generation make more sense in libpysal.cg or directly in spaghetti? My thought is probably in libpysal.cg. However, once I am graduated I want to also add the method for allocating populations to networks I propose in my dissertation. Whether this makes more sense in its own package or as part of spaghetti is something I would like to discuss/get other's opinions on. Any input is welcome.

Yes, @jGaboardi, I think too that it probably makes more sense on libpysal.cg, since it already has the Voronoi polygon generation in https://github.com/pysal/libpysal/blob/master/libpysal/cg/voronoi.py

I mean... we could add voronoi_lines, for example in this script.

@ResidentMario
Copy link
Author

If it's any incentive, I wrote a hacky single-use package called streetmapper to solve the problems that came up in this project for me. Once these features land in spaghetti, I'd love to rework that code to use these algorithms instead, and write an expository blog post on the subject in the style of Eli's "Neighborhood Segregation Dynamics" blog post. 🙂

@jGaboardi
Copy link
Member

@ResidentMario streetmapper looks very interesting. Would you be able to include a rudimentary notebook demonstrating functionality?

@ResidentMario
Copy link
Author

I could upload something to the notebooks/ directory, yes.

@jGaboardi
Copy link
Member

Yeah, or even just a link to something (this is something for my own curiosity). The explanation and docstrings of streetmapper are super interesting. I would love to see a use case.

@ResidentMario
Copy link
Author

Hi @jGaboardi, you weren't the only person to ask me this question, so I figured it was worth the time to write up a short blog post explaining how the streetmapper module works and my motivation for writing it: "Bringing together building, block, street, and point data".

This post links to the polished blog post with the analysis I used this library for as well as the repo with all of the raw code I wrote. Some of the use cases of having this point-to-line-to-adjacent-polygon algorithm on hand included:

  • Does street trash volume vary significantly between businesses?
  • Does street trash volume vary significantly with business type?
  • Is street trash volume correlated with Yelp! ratings?
  • Is street trash volume correlated with Yelp! stars?

@jGaboardi
Copy link
Member

openvoronoi

@jGaboardi jGaboardi added this to To do in v1.4 Stable Aug 23, 2019
@jGaboardi jGaboardi removed this from To do in v1.4 Stable Aug 23, 2019
@jGaboardi
Copy link
Member

jGaboardi commented Dec 24, 2019

We may want to explore:

@jGaboardi
Copy link
Member

#380

@jGaboardi jGaboardi mentioned this issue Jan 23, 2020
34 tasks
@jGaboardi jGaboardi mentioned this issue Feb 18, 2020
21 tasks
@martinfleis
Copy link
Member

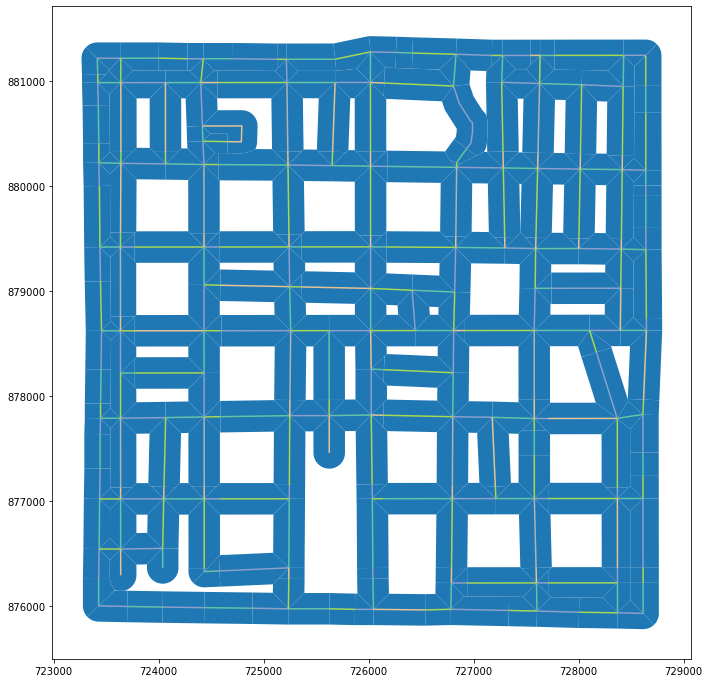
I think that this is already implemented in momepy. Or at least most of it.

import momepy
import geopandas
from shapely.geometry import box
from mapclassify import greedy
from libpysal import examples

path = examples.get_path("streets.shp")
gdf = geopandas.read_file(path)

# fill study area with tessellation
study_area = box(*gdf.total_bounds).buffer(50)

tess = momepy.Tessellation(gdf, 'ID', limit=study_area)
ax = tess.tessellation.plot(figsize=(12, 12), edgecolor='w')
gdf.plot(greedy(gdf, strategy="largest_first"), ax=ax, categorical=True, cmap='Set2')

Unknown

# limit to 150 feet from network geometry
tess = momepy.Tessellation(gdf, 'ID', limit=momepy.buffered_limit(gdf, 150), segment=10)

ax = tess.tessellation.plot(figsize=(12, 12))
gdf.plot(greedy(gdf, strategy="largest_first"), ax=ax, categorical=True, cmap='Set2')

Unknown-1

It is not properly documented, but it should do what you are looking for.

@jGaboardi
Copy link
Member

@martinfleis this is another great example for your push to standardize the network instances.

@martinfleis
Copy link
Member

Which reminds me that on one end of the conversion pipeline should be non-graph geodataframe. Since the example above is using gdf, not graph.

@jGaboardi
Copy link
Member

@martinfleis let's revisit this in the not-to-distant future.

@martinfleis
Copy link
Member

My proposal is to move generic voronoi algos from momepy to libpysal.cg and document it all there. Those could potentially also take a graph as an input, but we first need the standard of storing edge geometries in a graph.

Sign up for free to join this conversation on GitHub. Already have an account? Sign in to comment
Projects
v2.0.0 Stable
  
To do
Development

No branches or pull requests

4 participants