matplotlib 3D text orientation zdir #11804
Comments
|
You might accidentally have deleted the 3 backticks (```) needed to close the code environment, such that the graphics is not shown correctly. One should note here that which text is shown in which direction also depends on the azimuthal angle.
|

|
If I understand your issue right, what we are seeing isn't exactly a bug.
The tags are oriented according to the direction of the z vector as
projected in the 2D transformation that is employed. So, the z vector is
slightly tilted as you move away from the center.
If you don't want that to happen, mplot3d now has the option to specify an
'orthographic' projection:
https://matplotlib.org/users/prev_whats_new/whats_new_2.1.0.html#orthographic-projection-for-mplot3d
…On Tue, Jul 31, 2018 at 12:59 PM, Elan Ernest ***@***.***> wrote:
You might accidentally have deleted the 3 backticks (```) needed to close
the code environment, such that the graphics is not shown correctly.
One should note here that which text is shown in which direction also
depends on the azimuthal angle.
E.g. setting az=-10 in the above code reverses tag3 and tag4 but not the
other two.
[image: image]
<https://user-images.githubusercontent.com/23121882/43474530-7962fa16-94f3-11e8-9365-1a502affa0e5.png>
—
You are receiving this because you are subscribed to this thread.
Reply to this email directly, view it on GitHub
<#11804 (comment)>,
or mute the thread
<https://github.com/notifications/unsubscribe-auth/AARy-HEOX-MtSyUBZLITwAEKznf6lGNRks5uMI0EgaJpZM4VonEw>
.
|
|
.... and I think I misunderstood your report. Yes, the tags are automatically oriented based on which side of the center they are on. This was done in order to automatically have the axes label show up oriented "the right way". I can see how this may be undesirable in some circumstances. |
|
@WeatherGod The issue is rather that the text goes from bottom towards the top for some labels and from top towards the bottom for others. It looks like that is depending on the position, in the left part of the projected axes space they are pointing downwards, in the right space they are upwards. Neither |
|
@ImportanceOfBeingErnest @WeatherGod has there been any improvement on this front? I too would like to specify the text director with x, y, z float components between -1 and 1 (or 0 and 1) but currently setting
Changing the zdir argument to |
|
By playing with the |
|
This issue has been marked "inactive" because it has been 365 days since the last comment. If this issue is still present in recent Matplotlib releases, or the feature request is still wanted, please leave a comment and this label will be removed. If there are no updates in another 30 days, this issue will be automatically closed, but you are free to re-open or create a new issue if needed. We value issue reports, and this procedure is meant to help us resurface and prioritize issues that have not been addressed yet, not make them disappear. Thanks for your help! |
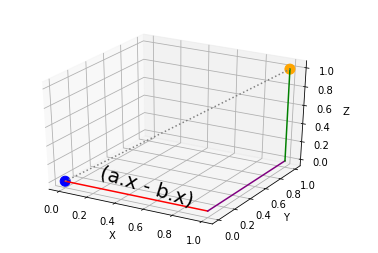
Bug report
When trying to tag point in a 3D scatter plot, the figure.text (same with text3D) the tag is rendered either descending on the left of the mid plan or rising on the right.
Code for reproduction
Actual outcome

Expected outcome
All text tags rising as zdir
Matplotlib version
print(matplotlib.get_backend())): module://ipykernel.pylab.backend_inlinepython 3.6
spyder 3.2.8
anaconda 1.8.7 2016
The text was updated successfully, but these errors were encountered: