A list of Earth-like candidates? You wish #21
Comments
|
Actually, I'm not going to make the recovery a new issue at the moment; but see the pdf that I just put in the sandbox folder. |
|
By this comment I ask @dfm to follow these up with some search and Bartification |
|
ps. If this holds up, it might be the first astronomical discovery posted in a github issue. |
|
Bekki, this is fantastic. I'm super impressed. |
|
yes, please do post T0 and period! |
|
I have posted t0 and period in detrending/poundstars. Let me know if anyone's able to do a quick check and reproduce any of these. Meanwhile, I'm going to investigate why I'm not recovering some of Dan's relatively large signal-to-noise transits, make improvements, and search the targets again; I'll also test the sensitivity to the imposed duration and depth. |
|
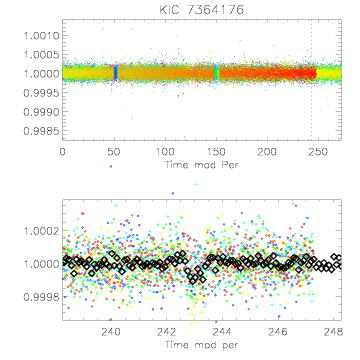
I tried fairly hard to try and detect the transits in second example shown above (7364176) without knowing the T0 and period using a median filter and BLS. I was not successful. This is (potentially) good news as Bekki may have achieved the goal of beating the median+BLS method. |
|
Thanks for checking, Tom! I'm concerned that the way I'm detrending could potentially be introducing artifacts (or distorting signals to look more like transits that they should) so I'm going to investigate this example (7364176) in more detail. |
|
(Note: The epochs I list are the start epochs; to obtain the mid transit time, add 0.265 days.) I see the dips in the PDC data of 7364176 before it's detrended, but the dips don't look very different from other stellar variability around them (which is also true in the detrended data). So it's unclear to me that the approach I was using was "right" to identify this signal as interesting. But that may be a question that the wavelet and/or Gaussian processes likelihood function needs to answer. If I search using (my version of the) wavelet instead of chi^2 likelihood, this signal is not found. (However, my version of the wavelet likelihood is bad at finding Dan's injected planets.) |
|
So I'm trying out some fitting on your candidates. The KIC 7364176 example shows some promise but I don't think that it's quite right. If I fit it with Bart + my GP likelihood, I get the following parameter constraints: where the columns are t0, r/R_, b/R_, period, ln(prob). This seems promising because the constraints are not the same as the initial condition. The reason why I'm not so sure about it is that when I fold the SAP fluxes, this is what it looks like: where the colour and offset show the "transit number". The dips do look somewhat transit-like but the depth is not consistent across transits. This makes me think that it might be an aliased period or a chance alignment of artifacts. Thoughts? |


|
We could consider a cutoff whereby the significance of the folded events has to be greater than some multiple (sqrt(2)?) of the most significant single event. This is similar to the MES/SES (multiple/single event statistic) ratio that was used in some earlier versions of the Kepler pipeline (they use a more complex cutoff involving chi^2 tests now). |
|
also, I'm a little concerned that Bekki's gallery only contains transits near the hairy edge of detection. Why are there no obvious transits of 2 R_earth planets when they are not thought to be intrinsically much rarer than 1 R_earth planets. |
|
If MES and SES are something like a transit SNR, then MES ~ N_transits SES, On Mon, Jul 1, 2013 at 5:41 PM, mrtommyb notifications@github.com wrote:
|
|
I also started writing some stuff down for using cross validation for vetting but I haven't coded it all up yet. All this opens another can of worms and I'm not sure whether or not it's the right direction to go but it would be fun to think about the options. |
|
This seems promising because the constraints are not the same as the
As for artifacts, do other stars on the same module have similar artifacts Cheers, |
|
Tom, it could be because most (if not all) of the signals in the gallery aren't transits; I included the two most significant signals for each star I searched. So this may be telling us there aren't any 300 ppm false alarms. The way I searched is fine-tuned to look for 80 ppm signals, so I'm going to try to tuning it to a higher level. For example, if a star had a 300 ppm planet and an 80 ppm artifact, the way I'm searching now may very well report the artifact instead of the larger planet. |
|
Eric: I would expect SNR to roughly scale with N_transits^(0.5). Bekki: yes you are of course right! I had in my head that these had passed some threshold in addition to being the most significant signal in the light curve. I would be interesting to see if there are any higher SNR 'detections' |
|
Dan: Your GP models assume that the noise is white Gaussian, right? Do you have a way to test against other colors of noise? With the red noise known to exist in the light curves, this would be the best chance of an alignment of artifacts. Has anyone found if a dv report exists for this 'candidate' or if it is on any TCE lists from any quarter? Billy ----- Reply message ----- Eric: I would expect SNR to roughly scale with N_transits^(0.5). Bekki: yes you are of course right! I had in my head that these had passed some threshold in addition to being the most significant signal in the light curve. I would be interesting to see if there are any higher SNR 'detections' Reply to this email directly or view it on GitHub: |
|
It doesn't assume that... that's exactly the point. I'm also modeling the SAP fluxes not de-trended fluxes. |
It's not listed as a TCE. Interestingly the official planet candidate for The plot thickens... On Mon, Jul 1, 2013 at 6:53 PM, Dan Foreman-Mackey <notifications@github.com
|
|
None of the stars I looked at have TCEs that aren't candidates. |
|
Here are some other ones of possible interest (also see gallery and file of periods/epochs periods_200.txt; obtained by tuning to a depth of 200 ppm):
Note: Some of the ones in the gallery (not these) didn't have the known KOIs properly subtracted out because some of the periods at the exoplanet archive seem to be incorrect/not precise for some reason, maybe due to TTVs. |


|
@dfm, what does the family of light curves predicted by GP look like (am I correct that you can plot a bunch of "gray" light curves that show the uncertainty in the model?) -- does it try to put transits in the light curves where we don't see one, or is it consistent with the noise component of the model that there aren't always visit transits? |
|
Hey @dawsonri, here's what the prediction looks like: Right now, I've fixed the hyperparameters of the GP noise model so the properties of the noise will be assumed to be the same across models. A few comments:
I'm still not sure what to make of this but let me know if you want any other figures, etc. |

|
P.S. the median period is 272.23173094 days vs. your 272.18844576 days |
|
Interesting! Could you post the pure noise models without the transits? The transits are shifted slightly to the left of where I except them, maybe to accomodate the blue data. Also, are the gray lines a collection of models and, if so, how many? This star falls on modules 8, 12, 18, and 14, which are all good modules, but 14 is a tiny bit worse than the other three. What are the hyperparameters of your noise model, and would it be possible to link some while letting others vary with module?
I don't search the periods very finely (only increments of about 0.1 days; that's another thing I should experiment with...), so that's consistent. |
I wouldn't dignify these with the term "candidates" but in the pound stars folder, I've put a zipped "gallery" of png images of the two most promising signals for each "pound star" (i.e. 72 bright, low-noise stars with known small, low-period planets). You'll see some examples of possible signals, and even more examples of detrending fails and transit-duration-timescale stellar variability (e.g. an especially deep wiggle among tons of similar wiggles).
A couple examples:
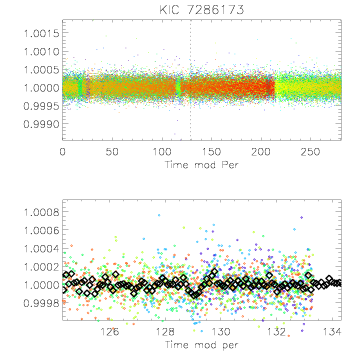
The colors represent a rainbow of time, from early (purple) to late (red). If the transit seems to be mostly one color (i.e. only occurring at one time) or different depths at different times/colors, be very suspicious.
Supposedly my program automatically masked out the signals of the known planets in the system but I haven't checked if that succeeded for every star (it worked for the several that I checked). Also, it's very possible that my detrending introduced transit signals or distorted true transit signals (see my other post, coming soon, about the recovery rate of Dan's injected planets; about 24% of planets are being detected and all are above 120 ppm transit depth). Speaking of, Ruth and Billy have been investigating how detrending distorts transits; you'll see that in our slides when we post them (and some interesting points and results by Hannu)
If any of these not-really-candidates catches your eye, let me know if you'd like me to take a closer look. Let me know if you'd like any more information or even if you'd like to have a "how the other half lives" type experience by looking at some of my IDL code.
The exact process through which they were obtained: detrend PDC using running median filter on each segment (between gaps); trim away edges of each segment; use wavelets to interpolate between gaps; at each datapoint, remove a 13 hour/80 ppm transit and record delta likelihood if delta likelihood is greater than zero [Note: this is equivalent to imposing a super-strict prior; I'm going to try imposing a weaker prior soon]; fold and sum likelihoods to identify best period. As you'll see in the other post, at the moment the chi^2 likelihood is working better than (my implementation of) the wavelet likelihood for this search process (i.e. performing better in recovering Dan's planets), but I'm hopeful that can be improved on.
All the best,
Bekki
The text was updated successfully, but these errors were encountered: