adjust width based on density #51
Comments
|
It does seem reasonable to match produces matching violins and points.
|
|
Yes - matching the default would be nice. Would it be possible to have |
|
I would like to also request a similar feature for For instance, you can see below that Thanks for your work on this useful package! library(ggbeeswarm)
#> Loading required package: ggplot2
dat <- structure(list(x = structure(c(1L, 1L, 2L, 1L, 1L, 2L, 1L, 1L,
1L, 1L, 1L, 1L, 2L, 1L, 2L, 1L, 2L, 1L, 2L, 1L, 1L, 1L, 1L, 1L,
2L, 1L, 1L, 1L, 2L, 1L, 2L, 1L, 2L, 1L, 2L, 1L, 1L, 1L, 2L, 1L,
2L, 1L, 1L, 1L, 1L, 2L, 1L, 1L, 1L, 2L, 1L), .Label = c("1",
"2"), class = "factor"),
y = c(0.00743015064770599, 0.00402350008901549,
0.0182015059430295, 0.0931013077022777, 0.0201296467502311, 0.00988912196583758,
0.00890949491496453, 0.0040521814310705, 0.0748063422432635,
0.0028265114618079, 0.0033580728734968, 0.0011570364882694, 0.00174334311680045,
0.300698451786883, 0.00186244761866073, 0.0117684502764761, 0.00578161092355426,
0.00651988531447871, 0.079985399989931, 0.00184351402134222,
0.00871624623132749, 0.00274545650752541, 0.00481711124028504,
0.00301568797492199, 0.00206841018634773, 0.00678981408558268,
0.00222290514238885, 0.00984868656785107, 0.00162418058758061,
0.00557005888481755, 0.121683319866249, 0.0030356653660198, 0.00210656116734316,
0.00353151727636117, 0.000903423206896699, 0.0162988509558787,
0.000853474507087549, 0.00220279909556151, 0.000414831444223472,
0.00233948134370524, 0.019787161002403, 0.00318015236414923,
0.00257190063774256, 0.0176909379302089, 0.00598338665216149,
0.136596738744799, 0.00128003795128495, 0.0202978906365311, 0.00156548169986173,
0.0168584387682024, 0.252985835349248)), row.names = c(NA, -51L
), class = c("tbl_df", "tbl", "data.frame"))
ggplot(dat, aes(x, y)) +
theme_bw(base_size = 22) +
geom_violin(draw_quantiles = c(0.5),
scale="width", width=0.6) +
geom_beeswarm(size=0.5, cex=1.5, priority = "random") +
ggtitle("cex = 1.5")
#> Warning in regularize.values(x, y, ties, missing(ties)): collapsing to unique
#> 'x' valuesggplot(dat, aes(x, y)) +
theme_bw(base_size = 22) +
geom_violin(draw_quantiles = c(0.5),
scale="width", width=0.6) +
geom_beeswarm(size=0.5, cex=2.5, priority = "random") +
ggtitle("cex = 2.5")
#> Warning in regularize.values(x, y, ties, missing(ties)): collapsing to unique
#> 'x' valuesCreated on 2020-09-08 by the reprex package (v0.3.0) |


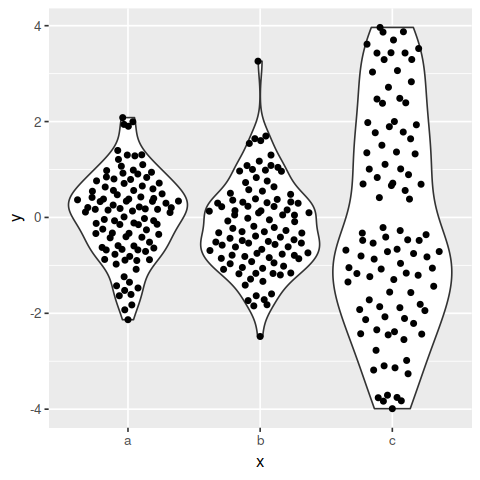
Hi - thanks for this package, it's really super!
Is it possible to adjust the width of the point distribution based on the density - similar to how geom_violin() works? I see that you can adjust the width based on the number of points, but it's not quite the same. I've given an example below - ideally, it would be possible to have the points inside the violin in the third column as well. Something analogous to
geom_violin(scale = 'area').Thank you,
Benjamin
The text was updated successfully, but these errors were encountered: