How to add tooltips to a plot? #12392
Unanswered
bryevdv
asked this question in
Internals and design (Q&A)
Replies: 1 comment
-
|
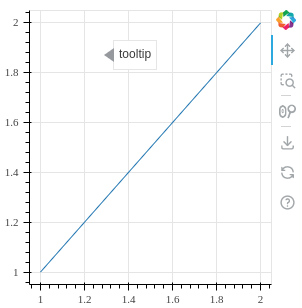
Same problem as in #12370 (review). from bokeh.models import Tooltip
from bokeh.plotting import figure, save
plot = figure(width=300, height=300)
plot.line([1, 2], [1, 2])
tooltip = Tooltip(
content="tooltip",
visible=True,
position=(100, 50),
target=plot,
)
save([plot, tooltip])
|
Beta Was this translation helpful? Give feedback.
0 replies
Sign up for free
to join this conversation on GitHub.
Already have an account?
Sign in to comment
-
@mattpap How can a user affix a
Tooltipto a fixed location on a plot, preferably using data-space coordinates? I triedexpecting to display at screen coordinates, but that did not display anything. I also tried
target=ByCSS("canvas")as well.Beta Was this translation helpful? Give feedback.
All reactions