Skip to content
New issue

Have a question about this project? Sign up for a free GitHub account to open an issue and contact its maintainers and the community.

By clicking “Sign up for GitHub”, you agree to our terms of service and privacy statement. We’ll occasionally send you account related emails.

Already on GitHub? Sign in to your account

index out of bounds error with plotting.py #18

Open
rumachan opened this issue Nov 10, 2021 · 13 comments
Open

index out of bounds error with plotting.py #18

rumachan opened this issue Nov 10, 2021 · 13 comments

Comments

@rumachan
Copy link

I am running REDpy on a single station using locally stored files. Running Ubuntu 18.04LTS.

[Settings]
title=Savo
filename=Savo.h5
groupName=Savo
groupDesc=Savo
nsta=1
station=SAVO
network=SW
channel=HHZ
location=10
server=file
searchdir=/home/sherburn/Commercial/Savo/SAVOsds/2021/SW/SAVO/HHZ.D/
winlen=512
cmin=0.80
minplot=20
dybin=0.125
nstaC=1
ncor=1
printsta=0

I have a total 10 months of data to process. Have run backfill in blocks of a month or two. Up to 4 months all was fine. Then with the 5th, the clustering was okay, but the plotting of clusters failed with an index out of bounds message. This example is from running forcePlot, but the error message is the same.

python forcePlot.py -c savo.cfg -a -r
Traceback (most recent call last):
  File "forcePlot.py", line 96, in <module>
    redpy.plotting.createPlots(rtable, ftable, ttable, ctable, otable, opt)
  File "/home/sherburn/git/REDPy/redpy/plotting.py", line 64, in createPlots
    plotFamilies(rtable, ftable, ctable, opt)
  File "/home/sherburn/git/REDPy/redpy/plotting.py", line 788, in plotFamilies
    r1 = [np.where(idf==xx)[0][0] for xx in id1[ix]]
  File "/home/sherburn/git/REDPy/redpy/plotting.py", line 788, in <listcomp>
    r1 = [np.where(idf==xx)[0][0] for xx in id1[ix]]
IndexError: index 0 is out of bounds for axis 0 with size 0
Closing remaining open files:Savo.h5...done

The relevant code segment is.

# Plot correlation timeline
            idf = ids[fam]
            ix = np.where(np.in1d(id2,idf))
            C = np.eye(len(idf))
            r1 = [np.where(idf==xx)[0][0] for xx in id1[ix]]
            r2 = [np.where(idf==xx)[0][0] for xx in id2[ix]]
            C[r1,r2] = ccc[ix]
            C[r2,r1] = ccc[ix]
            Cprint = C[np.argmax(np.sum(C,0)),:]

I can't see how the plotting is fine until some point and then fails, after which nothing I do seems to get the cluster families to plot again. Could this be something to do with the large number events detected and that clusters have many elements??

Many thanks.

@ahotovec
Copy link
Owner

@rumachan

This is a problem I haven't run into before! The problem seems to be related to trying to find correlation values for the members of the family in the correlation table, and it isn't finding them (returning an empty array, and then complaining that it has zero length when it expects it to have at least one value). In theory this shouldn't happen. It seems like this is potentially a symptom of a problem that happened earlier in the code that didn't raise an error.

A few questions first, and then we can work on a workaround...

  • Did you have any issues when running backfill.py before getting to the plotting step?
  • Is this a large family or a small one? If you run python forcePlot.py -l -c savo.cfg it'll only generate the html files and not the images, and at the top it'll list how many members the each family has. Look for the first family without images.

I have some ideas to get you back to processing with the hope that this is the only family that has this issue.

@rumachan
Copy link
Author

Thanks for your comments, and apologies for the late reply, was on leave a couple of days.

  • No, as far as I'm aware no issues running backfill.py before the plotting step. I have only just started (in the last month) using REDPy. Have worked on several different data sets (both recent and historical) accessing through FDSN to see how it performs. This is the only locally sourced data set I've worked on, and by far the longest time period.
  • Based on my limited experience, I'm dealing with some large families, the two largest have 1700 and 1900 members, respectively.
  • Running python forcePlot.py -l -c savo.cfg executed without any error. Looping through the cluster-specific pages from overview.html, the clusters without images typically have 2 or 3 members.
  • I have run both removeFamily.py and removeFamilyGUI.py to tidy up small clusters I don't want to see (they are usually noise as I'm using a single station). Has that contributed to my problem?

Many thanks.

@ahotovec
Copy link
Owner

Ah, gotcha!

It's possible that something went wrong in the removal step. I haven't run into issues yet, but for now that seems like a possible culprit. For now, my recommendation is this:

  1. Make a copy of your current .h5 file. I don't want you to lose work if this doesn't work!
  2. Move the contents of the output and clusters directory to a backup location, and leave the directories empty save for the directory structure.
  3. Run python forcePlot.py -a -c savo.cfg and take note of what cluster number it stops rendering images for.
  4. Use removeFamily.py to remove that family. The code will then try to render the outputs again.
  5. If that fails, try forcePlot again just to be sure.

Let me know how that goes.

@rumachan
Copy link
Author

Thank you for the advice. Here's what happened.

  • python forcePlot.py -v -a -c savo.cfg gave the 'normal' error. The cluster_number.png images were created, but not the html files for each cluster, so I couldn't determine on which cluster it fell over.
  • I then ran python forcePlot.py -v -l -c savo.cfg to make the html files. That completed successfully, but the only content for every html page was summary and the single image - not the graphs.
    Screenshot from 2021-11-17 08-39-00
  • I repeated python forcePlot.py -v -a -c savo.cfg with the same error and no changes to the output.

A bit odd I think. Many thanks

@ahotovec
Copy link
Owner

ahotovec commented Nov 16, 2021

So none of the family plots (starting "fam*.png") rendered? I'm not surprised that the .html didn't render, since it gets rendered last.

Let's try python forcePlot.py -v -c savo.cfg -f -s 1 — what this does will skip trying to render the first family, and try to render the rest. Where does that fail?

@rumachan
Copy link
Author

Hmmm, python forcePlot.py -v -c savo.cfg -f -s 1 completed without error!!! The cluster html pages all look good.

Cluster 0 is the problem, confirmed when python forcePlot.py -v -c savo.cfg -f -e 1 failed. That cluster has 1912 members.

@ahotovec
Copy link
Owner

ahotovec commented Nov 17, 2021

For now, let's have you replace lines 787-792 of redpy/plotting.py with this:

            C = np.eye(len(idf))
            try:
                r1 = [np.where(idf==xx)[0][0] for xx in id1[ix]]
                r2 = [np.where(idf==xx)[0][0] for xx in id2[ix]]
                C[r1,r2] = ccc[ix]
                C[r2,r1] = ccc[ix]
            except IndexError:
                print('Found issue printing correlation timeline in family {}'.format(cnum))         
            Cprint = C[np.argmax(np.sum(C,0)),:]

Basically, it's going to try to skip trying to find the values of the correlation matrix if it fails. There's probably a more elegant way to do this, but it's difficult to write code without having the problem with me! Pick up where you left off with your processing, and see if the problem persists with the next timestep.

I'm going to leave this issue open and not commit these changes in case someone else runs into the issue. I'm not sure what the conditions to reproduce the issue are, and so can't fix the root issue.

@rumachan
Copy link
Author

Thank you, that work as you intended.

python forcePlot.py -v -c savo.cfg -f -e 1
Using config file: savo.cfg
Opening hdf5 table: Savo.h5
Creating requested plots...
Found issue printing correlation timeline in family [ 380  379  395 ..., 5832 5838 5881]
Closing table...
Done

I've implemented this as a new local branch for the time being. I agree it's difficult for you when all you have are my 'it doesn't work' comments. And it was really odd that it only occurred after some of my processing and with just this data set.

I'd get some more of the data I've been working on and then run REDpy for a further 2-3 weeks of data and let you know how it goes. Probably that won't be until next week. Until then, many thanks.

@ahotovec
Copy link
Owner

Great! Also, I found a small issue in the code I sent you. I've edited it so that the "found issue" print message is more informative (variable fam should be cnum).

Good luck!

@rumachan
Copy link
Author

Thank you. I thought the output of that print was a bit odd, in that it didn't specify family 0, but assumed there was some internal referencing going on. Thanks again!

@rumachan
Copy link
Author

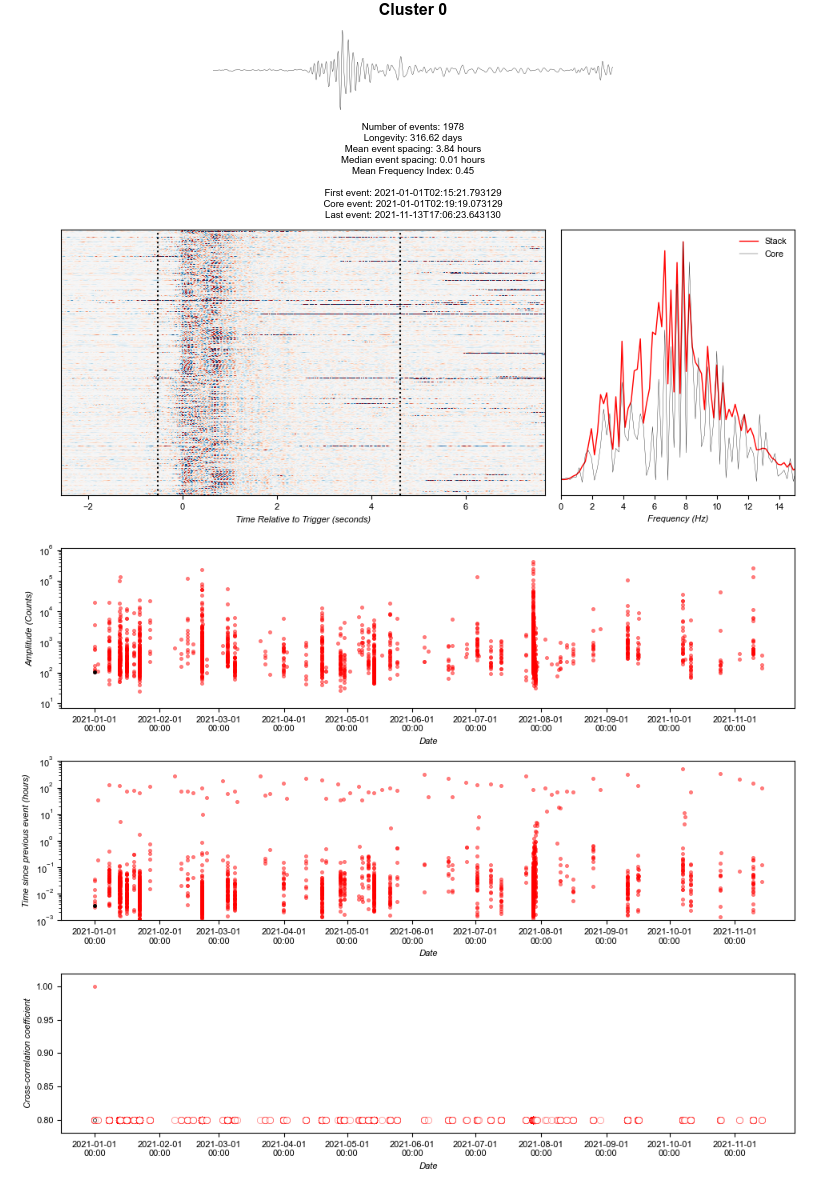
Yesterday I ran the extra data I mentioned. Plotting completed fine with cluster 0, the problem cluster.

2021-11-15T23:00:00.000000Z
Length of Orphan table: 561
Number of repeaters: 6251
Number of clusters: 476
Time spent this iteration: 0.1514268716176351 minutes
Caught up to: 2021-11-15T23:59:44.640000Z
Updating plots...
Found issue printing correlation timeline in family 0
Closing table...
Total time spent: 85.59146936734517 minutes
Done

So that looks good.

I noticed that the cross-correlation values for cluster 0 look odd. All at the 0.8/undefined value. No other clusters show this, and I'm afraid I don't know if it has occurred since our modification, or potentially is related to the root cause of the problem.
Screenshot from 2021-11-23 10-37-24
What do you think?

@ahotovec
Copy link
Owner

This is part of the workaround. I put the try/catch around the definition of the variable this is attempting to plot. Since that variable was not filled, it plots it as effectively empty.

@rumachan
Copy link
Author

Understood. So I'm all good. Thank you for all your help.

I have something else that is unrelated, so I'll put it in a separate ticket.

Sign up for free to join this conversation on GitHub. Already have an account? Sign in to comment
Labels
None yet
Projects
None yet
Development

No branches or pull requests

2 participants