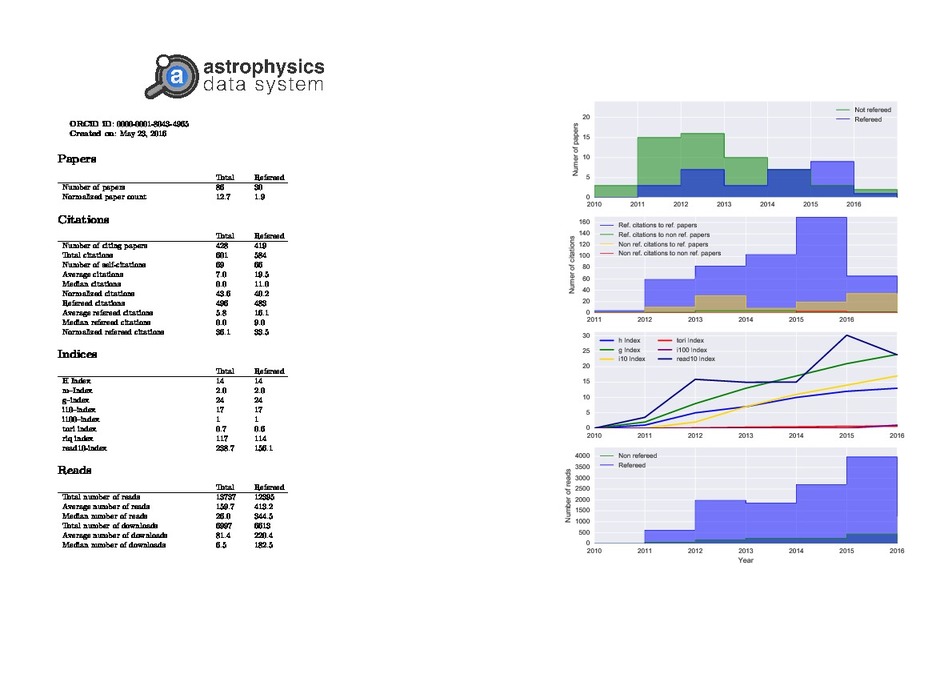
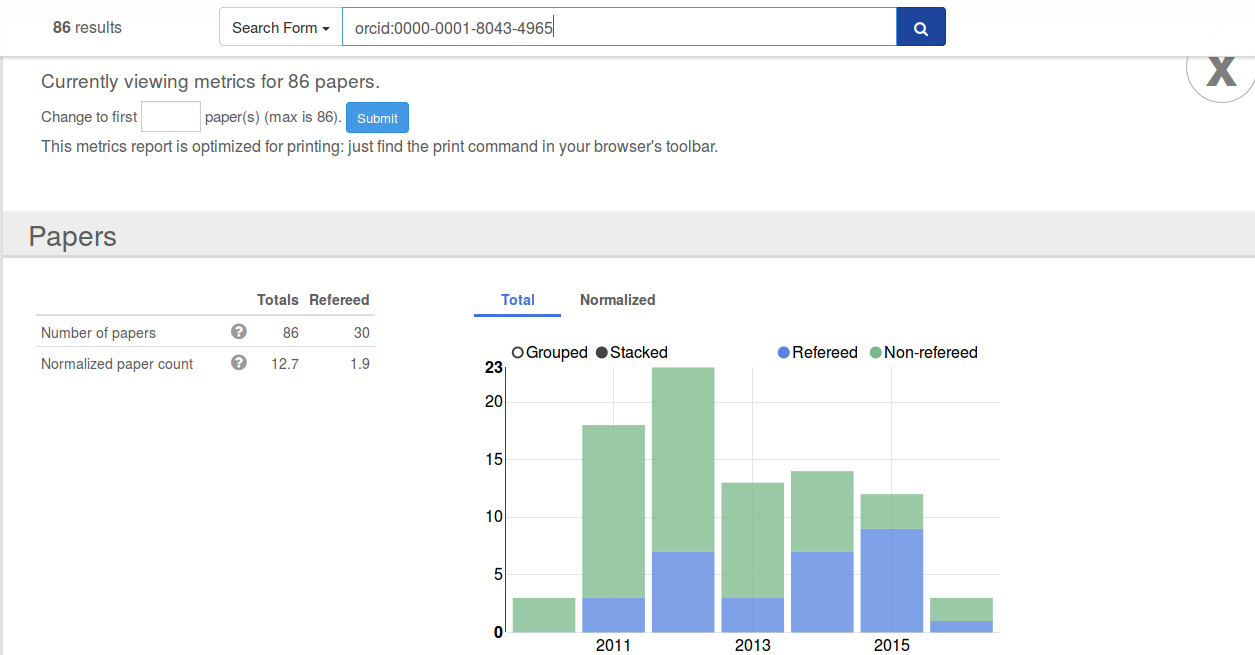
A tool to plot metrics for a given set of bibcodes using the ADS API. It makes printer-friendly versions of the one that you find on the ADS user interface:
This tool allows you to create metrics plots in three ways:
- via an ORCiD iD
- via a generic ADS query
- via a list of bibcodes
You can generate hard copies of these plots in image or CSV format. In addition, you can create a snazzy PDF that includes your metric statistics, plus a head page with the ADS logo.
Note This tool is limit to 2000 bibcodes, as this is the limit prescribed by the ADS API (for the metrics service). If you want to do a numbers plot for a larger amount of data, then look at the Search Facet tool.
Example usage:
python plot_metrics.py --orcid 0000-0001-8043-4965 --printable --plot --save-to-file csv
Makes plots like this: